8.9.3. Setting up a Netdata server
8.9.3.1. Introduction
This procedure describes the installation of a Netdata monitoring server and its interconnection to a GCenter for monitoring purposes.
Note
The Netdata version compatible with GCenter and GCap is 1.19
The configuration consists of:
8.9.3.2. Prerequisites
User : member of Administrator group
8.9.3.3. Preliminary operations
Login to GCenter via a browser (see Connecting to the GCenter web interface via a web browser). with the prerequisite rights.
8.9.3.4. Procedure to install via docker
Enter the following command to install the Netdata docker.
docker pull netdata/netdata:v1.19.0
Enter the following command to be able to edit the Netdata configuration from the host machine, you must launch a temporary container to retrieve the configuration files.
mkdir netdataconfig
docker run -d --name netdata_tmp netdata/netdata
docker cp netdata_tmp:/usr/lib/netdata netdataconfig/
docker rm -f netdata_tmp
Enter the following command to launch the final container
docker run -d --name=netdata \
  -p 19999:19999 \
  -v $(pwd)/netdataconfig/netdata:/usr/lib/netdata:rw \
  -v netdatalib:/var/lib/netdata \
  -v netdatacache:/var/cache/netdata \
  -v /etc/passwd:/host/etc/passwd:ro \
  -v /etc/group:/host/etc/group:ro \
  -v /proc:/host/proc:ro \
  -v /sys:/host/sys:ro \
  -v /etc/os-release:/host/etc/os-release:ro \
  --restart unless-stopped \
  --cap-add SYS_PTRACE \
  --security-opt apparmor=unconfined \
  netdata/netdata
8.9.3.5. Procedure to configure stream.conf and GCenter
Enter the following command to generate the uuid.
sudo docker exec -it netdata uuidgen
- Enter the following commands to configure stream with the uuid generated previously.Netdata recommends to use edit-config
sudo docker exec -it netdata /etc/netdata/edit-config stream.conf[dd236090-a42d-43e2-b0ba-ff8eaa6216a2] << Remplacer l'uuid ici enabled = yes default history = 36000 default memory mode = ram health enabled by default = auto allow from = * default postpone alarms on connect seconds = 60
Enter the following commands to configure netdata.conf
sudo docker exec -it netdata /etc/netdata/edit-config netdata.conf[global] ... hostname = netdata-docker.gatewatcher.com ... timezone = Europe/Paris
Enter the following commands to configure the Netdata export in the GCenter.
Note
Read the Netdata configuration parameters in the Netdata part visible in the `Admin-GCenter-Configuration` screen of the legacy web UI.For Netdata to send notifications, you must configure the health_alarm_notify.confsudo docker exec -it netdata /etc/netdata/edit-config health_alarm_notify.conf
See also the reference documentation : Alarm Configuration
8.9.3.6. Procedure to create alerts for Netdata
Enter the following commands to create alerts in the container folder:
/usr/lib/netdata/conf.d/health.d
Note
In order for the new alerts to be taken into account, it is necessary to restart the docker container.
- Enter the following commands to create your own alertsTo clarify the management of alerts, it is advisable to create a *.conf` file by alert category.Here are some examples:
Description
Link
Alert in case of absence/traffic overload
Alert in case of deactivation of GCap analysis services
Alert if a restart of Gcap/GCenter has occurred
RAM overload alert
Alert in case of "dropped" network packets on the Gcap
Alert in case of disk filling (here the/data partition of the Gcap)
CPU overload alert
The creation of alerts is based on the metrics that Netdata collects.
To know these metrics, you must connect to the GCenter Netdata interface.
https:// IP ou FQDN du GCenter /gstats
RAM monitoring example
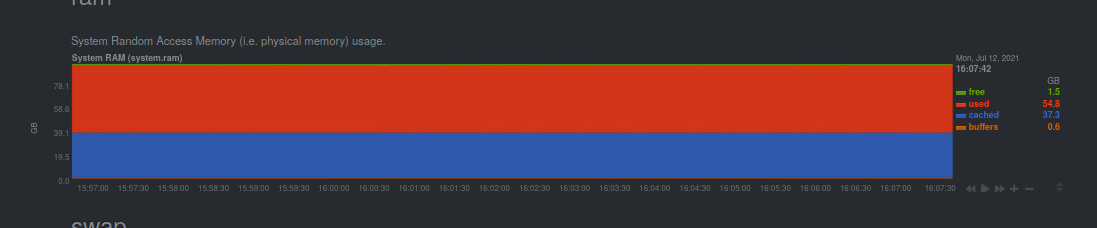
The name of the Graph is system.ram, and the curve to watch is used.The alert in the ram.conf file will be written as follows:
The alarm is named as follows:
1>> alarm: ram_usage
The alarm is named as follows:
2>> on: system.ram
The 10 min average of the used curve is calculated as follows:
3>> lookup: average -10m percentage of used
The unit is specified as follows:
4>> units: %
The time interval between each calculation is specified as follows:
5>> every: 1m
Alert and critical thresholds are specified as follows:
6>> warn: $this > 70
7>> crit: $this > 90
The delay to clear the alarm after triggering is specified as follows:
8>> delay: down 15m multiplier 1.5 max 1h
The alarm description is specified as follows:
9>> info: average RAM utilization over the last 10 minutes
The definition that will be alerted (see health_alarm_notify.conf) is defined as follows:
10>> to: sysadmin