5.6.3. Web UI `Top risk` screen
After pressing one of the `HOME` buttons and then the `TOP RISK` button, the following screen is displayed.
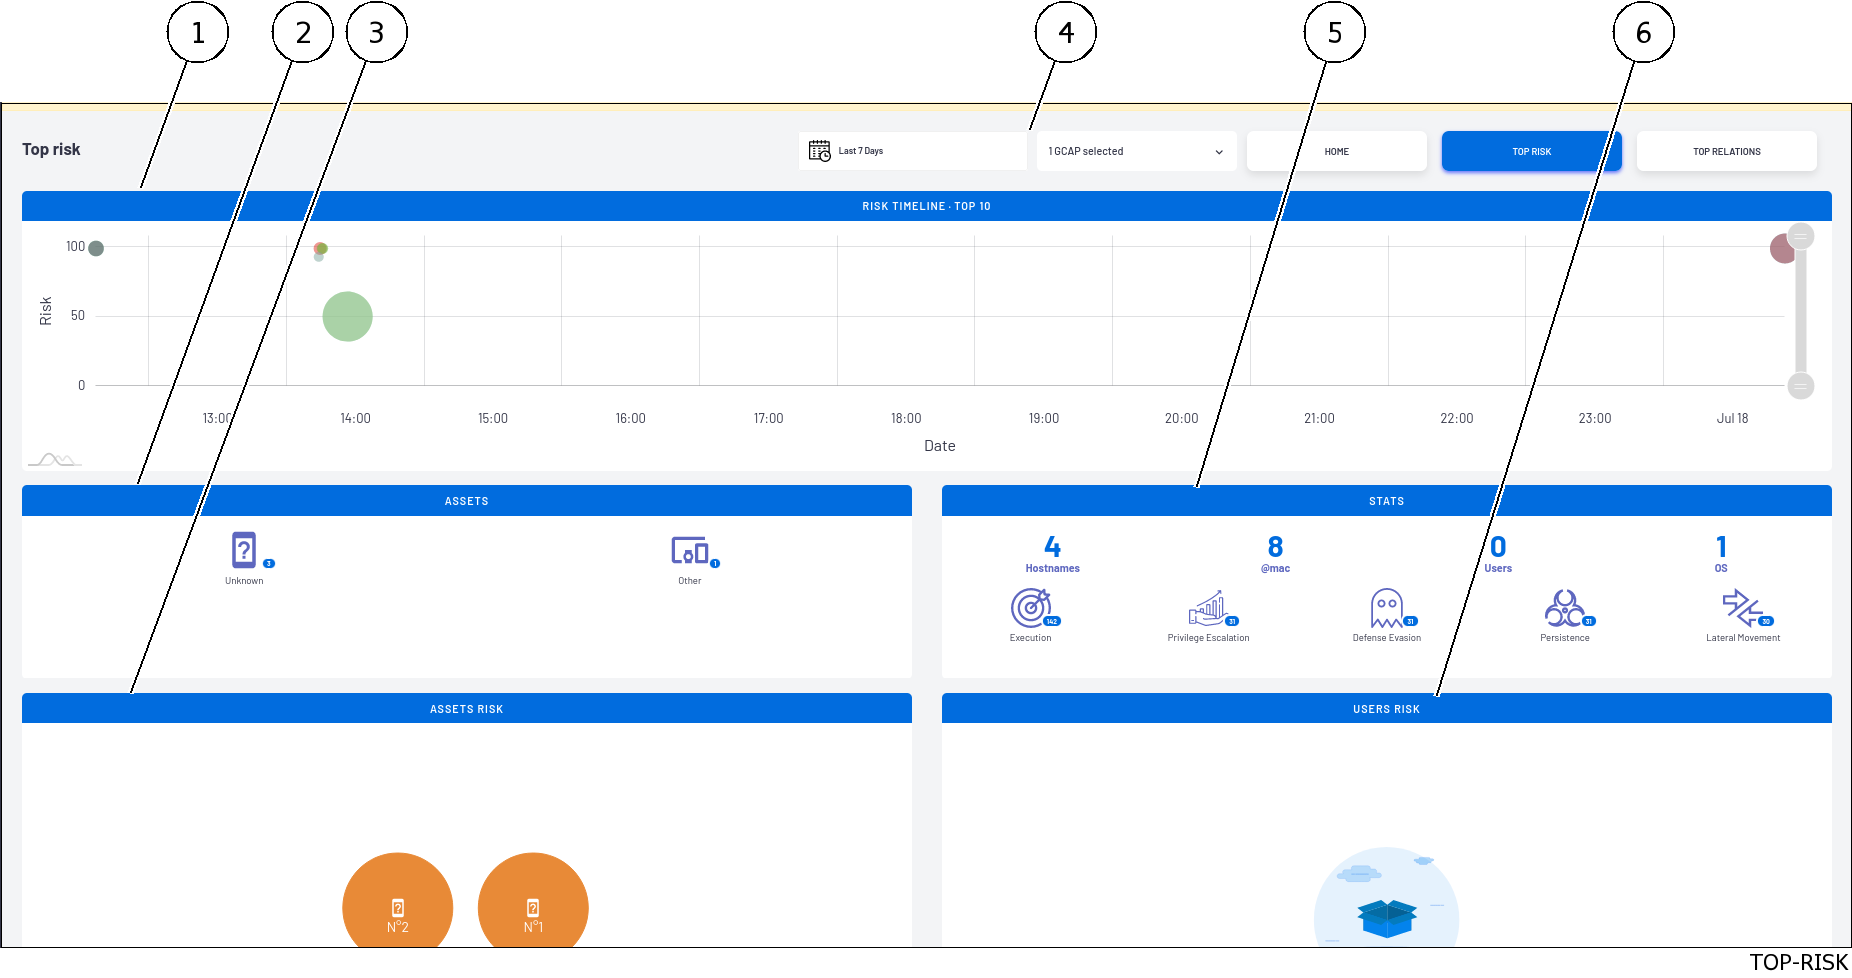
This screen includes the following:
Benchmark |
Zone |
To display |
|---|---|---|
1 |
Alarm timing and risk levels |
|
2 |
List of active equipment found |
|
3 |
Representation of the number of alerts of active equipment |
|
4 |
Statistics on detected threats; |
|
5 |
A list of meters |
|
6 |
The number of alerts from active users |
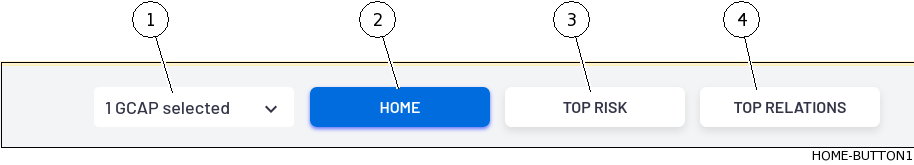
5.6.3.1. Dashboard Selector
The screen displays a set of:
A button to select the GCap whose information was displayed
Three buttons to define the theme of the displayed elements
Item |
Name |
Description |
View Description |
|---|---|---|---|
1 |
View Selected GCaps |
GCap Selection |
|
2 |
|
Default Display Selection |
|
3 |
|
Selecting the Main Risk Screen |
below |
4 |
|
Selecting the Main Relations Screen |
5.6.3.2. `RISK TIMELINE` zone
The `RISK TIMELINE` zone indicates the alarm sequence and their risk levels:
Horizontal axis: date and time of threat
Vertical axis: risk level
- Each threat is placed on the graph, its size indicating the number of alerts.Hovering over the threat displays the following:
Hostname
IP
Risk
Alert count
Date
MITRE threat type
5.6.3.3. `ASSETS` zone
`ASSETS` zone displays the list of active equipment found in the detected threats.`Assets` window is displayed on that equipment.5.6.3.4. `ASSETS RISK` zone
`ASSETS RISK` zone displays the number of alerts of active equipment in the form of a bubble.`Assets` detailed window is displayed on that equipment.5.6.3.5. `STATS` zone
The `STATS` zone displays the following counters:
`Hostnames``@mac``Users``OS`MITRE counters:
`Execution`
`Persistence`
`Privilege Escalation`
`Defense Evasion`
`Lateral Movement`If a counter is pressed, the system displays a detailed list of each of these risks (Alerts screen).
5.6.3.6. `USERS RISK` zone
The `USERS RISK` zone displays the number of active user alerts as bubbles.