5.6.10. Web UI `Alerts` screen
`Alerts` button on the navigation bar, the following screen appears.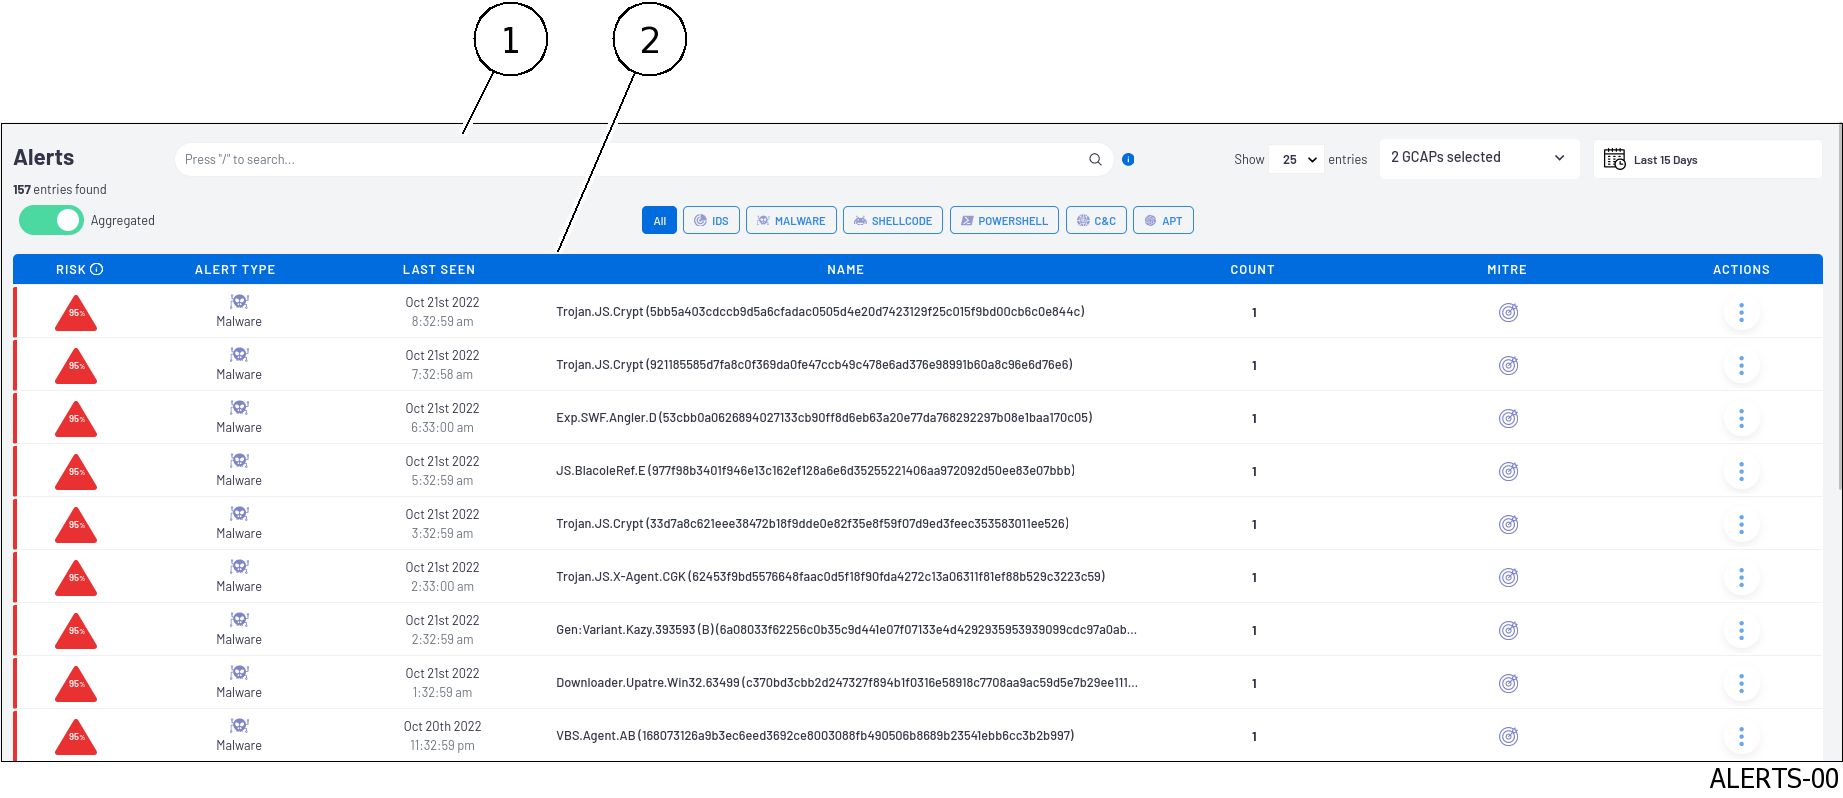
Item |
Description |
|---|---|
1 |
Dashboard selector |
2 |
Display area for the list of filtered alerts |
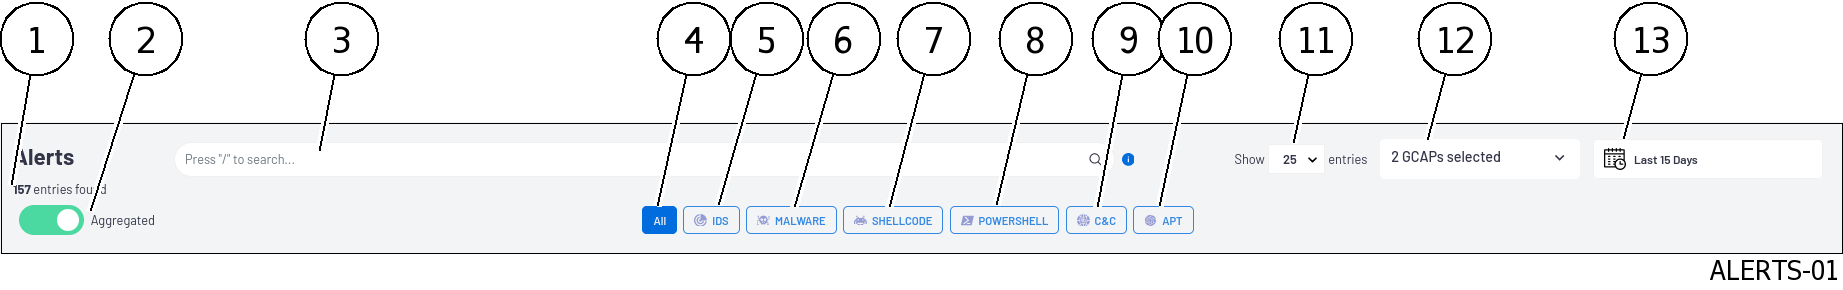
5.6.10.1. `Alerts` screen dashboard selector
The selector includes the following items:
Item |
Name |
Description |
|---|---|---|
1 |
Number of results |
Display of the number of records found:
depends on the selection choices for the display i.e. Aggregated selector, All selector, and so on.
|
2 |
|
Aggregates the records. In this mode the information fields are different. |
3 |
Search field |
Enables entering a text to be searched in the page |
4 |
|
Filters records with all alert types: |
5 |
|
Filters out records whose alert type is
`IDS`:Equivalent to entering 'type:ids' in the search field
|
6 |
|
Filters out records whose alert type is
`MALWARE`:Equivalent to entering 'type: malware' in the search field
|
7 |
|
Filters out records whose alert type is
`SHELLCODE`:Equivalent to entering 'type: shellcode' in the search field
|
8 |
|
Filters out records whose alert type is
`POWERSHELL`:Equivalent to entering 'type: powershell' in the search field
|
9 |
|
Filters out records whose alert type is
`C&C`:Equivalent to entering 'type:c&c' in the search field
|
10 |
|
Filters out records whose alert type is
`APT`:Equivalent to entering 'type:apt' in the search field
|
11 |
|
Selection of the number of lines per page
|
12 |
GCap Selector |
Selection of GCap |
13 |
Time period selector |
Selection of the display period |
Note
Several types of alerts can be selected by pressing buttons 5 to 10.
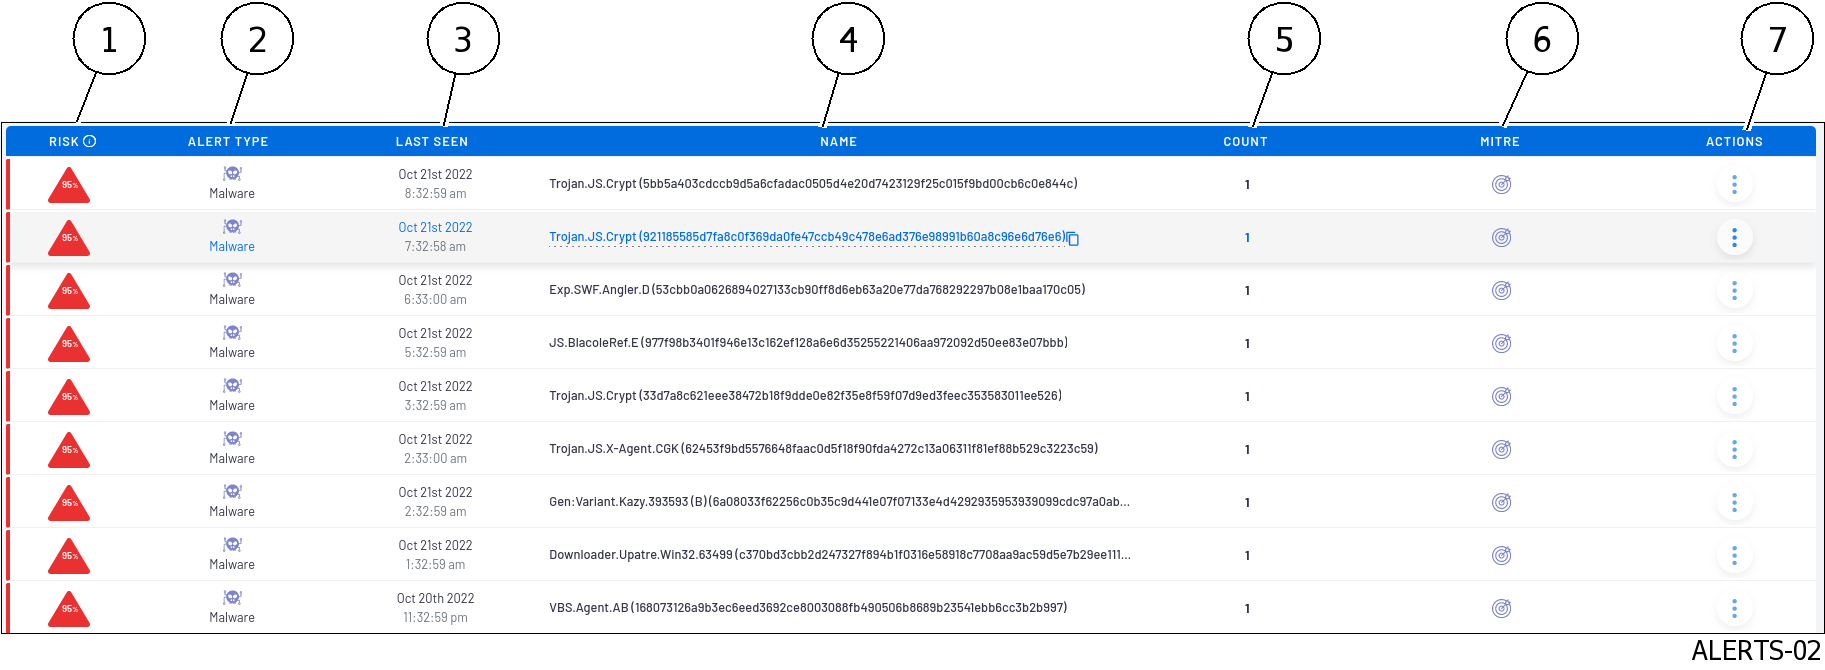
5.6.10.2. Display area for the list of alerts in aggregate mode
The display consists of:
Item |
Name |
Description |
|---|---|---|
1 |
|
Type of risks. The risk level is indicated by the color. The type of risk is indicated by the corresponding icons.
By clicking on an icon in column (1), a window displays information about the selected threat (NAME field).
There may be several records.
|
2 |
|
Type of alerts detected |
3 |
|
Date and time of last occurrence of this threat |
4 |
|
Name of the detected threat |
5 |
|
Number of cumulative records with the same detected threat |
6 |
|
Viewing the MITRE category |
7 |
|
Menu of possible actions. Depends on the recording (Go hunting, Download Shelcode, Generate CFG, Display Data..) |
Astuce
Alerts are detected by engines that:
Work
Are up to date
Have been activated
The current motor status is displayed in the Web UI `Health checks` screen.For the Malcore engine, check the white and black list that intervene on the alarm detection display.For the Codebreaker engine and the detection of shellcodes and powershells, this detection is not enabled by default and is defined in the profiles sent to GCap (see Web UI `Config - Gcaps profiles` screen).For the Machine Learning engine for DGA detection (C&C), this engine must be enabled (see `Admin-GCenter- ML Management` screen of the legacy web UI).For the CTI engine to generate alerts for Advanced Persistent Threat (APT) threats, this engine must be enabled (see `Admin-GCenter- CTI Configuration` screen of the legacy web UI).
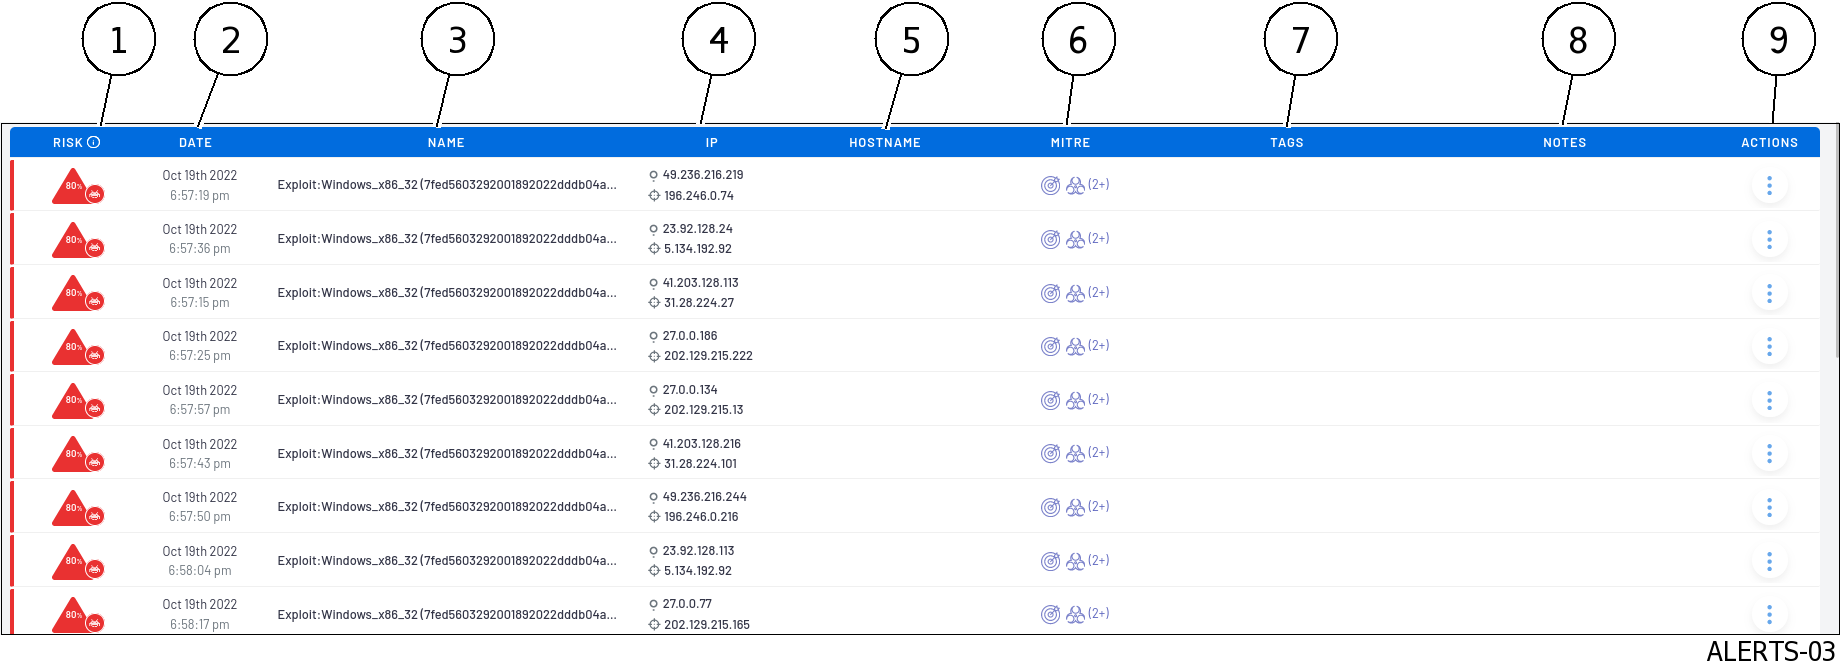
5.6.10.3. Display area for the list of alerts in non-aggregated mode
The display consists of:
Item |
Name |
|
|---|---|---|
1 |
|
Type of risks. The risk level is indicated by the colour. The type of risk is indicated by the corresponding icons.
By clicking on an icon in column (1), a window displays information about the selected threat (
`NAME` field).There may be several records.
|
2 |
|
Date and time of the recording |
3 |
|
Name of the detected threat |
4 |
|
The first IP address is the source address
The second IP address is the destination address
|
5 |
|
The first hostname is that of the source
The second hostname is that of the destination
|
6 |
|
Viewing the MITRE category |
7 |
|
Tags field if indicated (Confirmed incident, Critical, Doing, Done) |
8 |
|
Notes field if indicated |
9 |
|
Menu of possible actions. Depends on the recording (Signature definition, Alert history, Alert summary, Flow details) |
5.6.10.4. The sub menu `ACTIONS`
This menu displays:
In the header:
The type of threat (malware for example),
The result of the analysis (infected for example) and
The name of the threat (Trojan/Win32.Ursnif, Generic.Nymaim.E.DA42CE72 for example)
- An command listThe commands depend on the type of threat and are detailed in the following tables:
Note
These commands are not fully activated in the Aggregated mode.
5.6.10.4.1. Commands for an IDS
Order |
Action |
|---|---|
|
Displays the rule that detected the alert in the legacy web UI. |
|
Displays the history of this alert precisely.
To do this, the Kibana interface is opened on the
`Overview` section of the `Sigflow` tab and the database is filtered on the `alert.signature' parameter` or on the `alert.signature_id` parameter. |
|
Displays summary of this alert
To do this, the Kibana interface is opened on the
`Overview` section of the `Sigflow` tab and the database is filtered on the `alert.signature_id` and parameter on the IP address of the source (`src_ip`) and the destination (`dest_ip`). |
|
Displays flow details.
To do this, the Kibana interface is opened on the
`Messages` section of the `Sigflow` tab and the database is filtered on the `flow id` parameter. |
5.6.10.4.2. Commands for a malware
Command |
Action |
|---|---|
|
Displays file transactions.
To do this, the Kibana interface is opened on the
`Overview` section of the `Malcore` tab and the database is filtered on the `fileinfo.sha256` parameter. |
|
Displays flow details.
To do this, the Kibana interface is opened on the
`Messages` section of the `Malcore` tab and the database is filtered on the `flow id` and `fileinfo.sha256` parameter.This window displays the detection details of this file. This information is detailed in Events generated.
|
|
Downloads the compressed file (name is UD.zip) to the user’s PC. |
|
Send the file for a remote analysis (to a GBox for example).
If no remote server is connected then a message appears
`Server error`If the remote server is running then a report generation message appears.
|
|
Download the remote server analysis report in pdf format.
|
5.6.10.4.3. Commands for a shellcode
Command |
Action |
|---|---|
|
Displays threat details.
For this, the Kibana interface is opened on the
`Messages` section of the `Codebreaker` tab and the database is filtered on the `SHA256` parameter. |
|
Downloads the compressed file (name is UD.zip) to the user’s PC. |
|
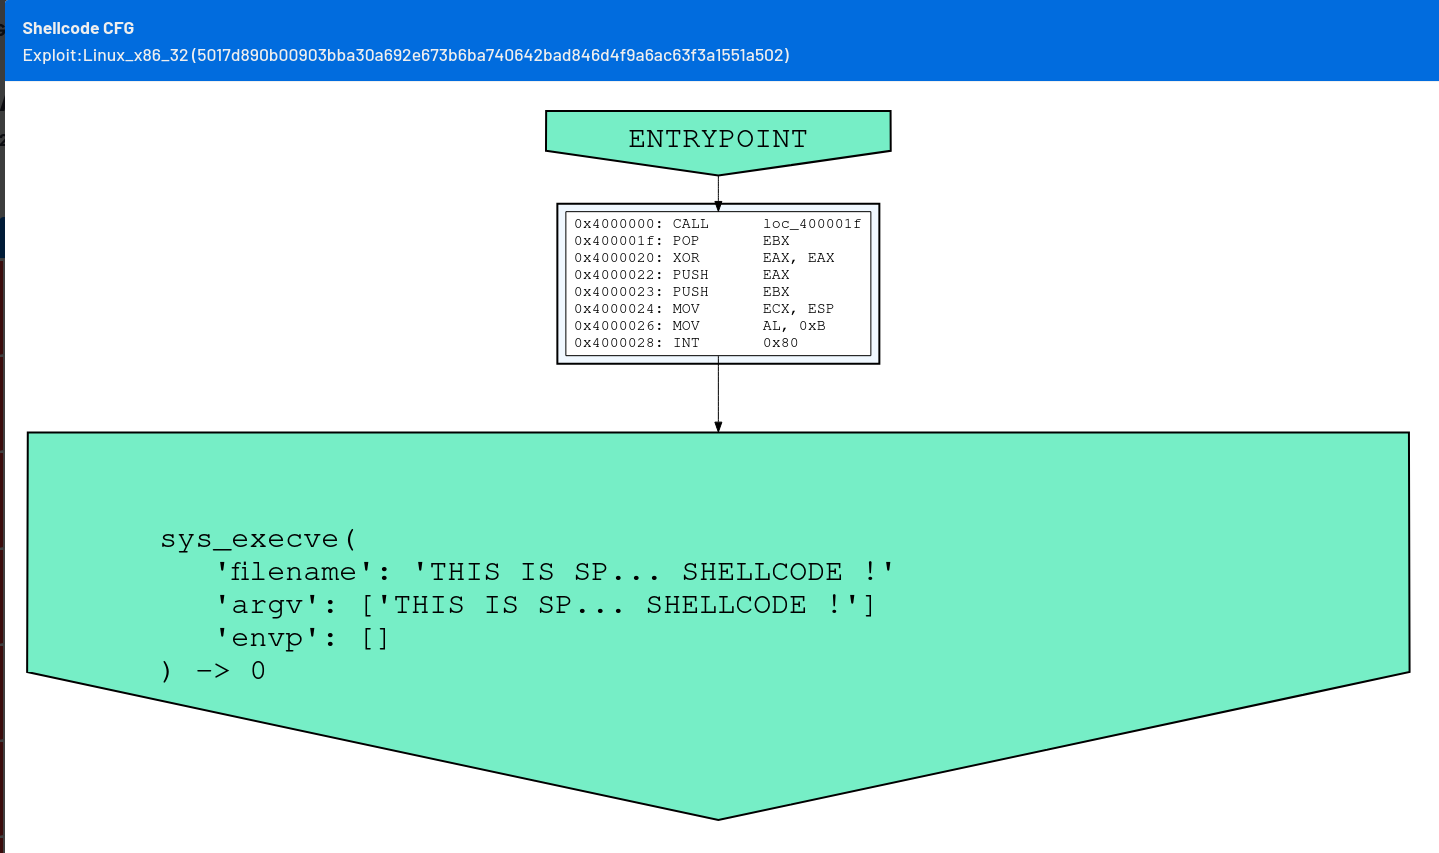
Generate the control flow graph (CFG) to obtain a graphical and simplified version of the Shellcode instructions detected. : an example is given below. |
|
Displays the file |
Below is an example of a CFG generation of a simple shellcode detected by the CODEBREAKER analysis engine:
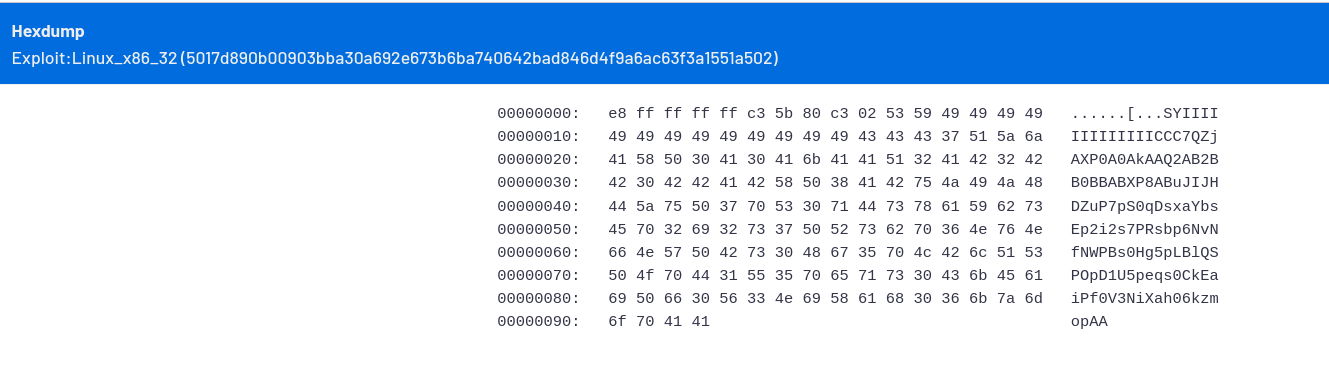
Below is an example of file content:
5.6.10.4.4. Commands for a powershell
Command |
Action |
|---|---|
|
Displays threat details.
To do this, the Kibana interface is opened under the heading
`Messages` of the `Codebreaker` tab and the database is filtered over the `SHA256` parameter. |
|
Downloads the compressed file (name is UD.zip) to the user’s PC. |
|
Displays the file |
5.6.10.4.5. Orders for a DGA (C&C)
Command |
Action |
|---|---|
|
Disable DGA detection for this specific domain. To do so, this domain is added to the whitelist.
After this whitelist, this domain will no longer be analyzed.
|
|
Disable DGA detection for this type of domain extension. To do so, this type of domain extension is added to the white list.
After this whitelist, threats on this type of domain extension will no longer be analyzed.
|
|
Displays DGA information on this domain.
This command opens a
`Kibana` window in the `ML` tab with the `Overview` option enabled and the database is filtered for the current domain name with the parameter `domain_name`. |
|
This command opens the
`Domain Name White List` window of the `White List` section of the `DGA Detection Management` category.This shortcut allows you to view the domain names added by previous commands in the whitelist.
This screen also allows you to edit the whitelist.
|
|
Displays DGA information on the IP source.
To do this, the Kibana interface is opened in the tab
`ML` with option `Overview` and the database is filtered on the parameter `src_ip`. |
|
Displays DGA information on the detected flow of the DGA alert
To do this, the Kibana interface is opened in the tab
`ML` with option `Messages` and the database is filtered on the parameter `flow_id`. |
5.6.10.4.6. Commands for an APT
Command |
Action |
|---|---|
|
Displays the OBI summary.
To do this, the Kibana interface is opened in the
`Retrohunt` tab with `Overview' option enabled and the database is filtered on the ```ioc_id` parameter. |
|
Displays OBI details.
To do this, the Kibana interface is opened in the
`Retrohunt` tab with `ICO` option enabled and the database is filtered on the `ioc_id` parameter. |
|
Displays suspicious network flow details
To do this, the Kibana interface is opened on the
`Retrohunt` section of the `All` tab and the database is filtered on the `uuid` parameter. |
5.6.10.5. Alert information window
By clicking directly on an alert, the following window is displayed:
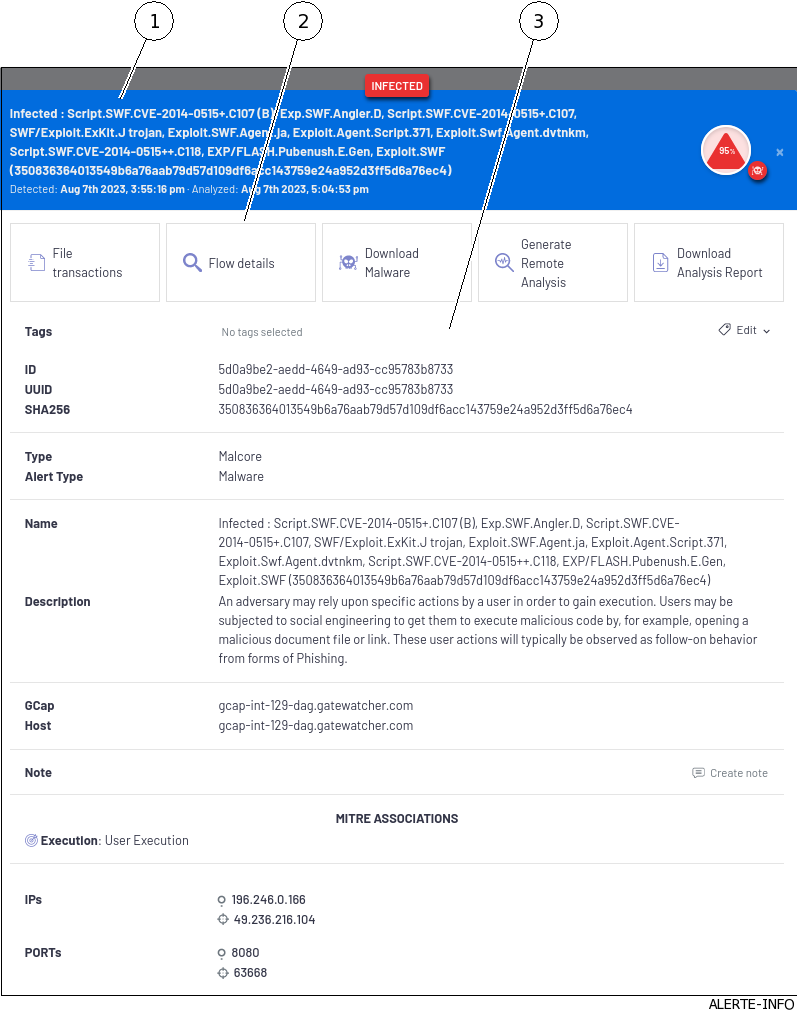
The window consists of 3 parts:
- Upper part (1): the summaryThis section summarizes the alert, including:
The level of risk
The name of the detected threat
Detection date and time
- Intermediate part (2): possible actionsThis part shows the buttons of possible actions on this alert: these are the same actions as the commands detailed in the previous paragraphs.
- lower part (2): detailed informationThis section displays detailed information on:
The file (ID, UUID, SHA256...)
The detected threat (type, type alert, name, description...)
Source GCap (GAP, Host)
etc