8.9.1. Configuring the Netdata polling interface
8.9.1.1. Introduction
This procedure describes the configuration of the Netdata interface to allow a remote server (for example NAGIOS) to read the selected metrics via the netdata API.
User Authentication:
List of authorized IP addresses
List of accessible metrics
Below, an extract of the metrics is displayed.
# chart: net_drops.vnet0 (name: net_drops.vnet0)
NETDATA_NET_DROPS_VNET0_INBOUND="0"      # drops/s
NETDATA_NET_DROPS_VNET0_OUTBOUND="-0"      # drops/s
NETDATA_NET_DROPS_VNET0_VISIBLETOTAL="0"      # drops/s

# chart: net_errors.vnet0 (name: net_errors.vnet0)
NETDATA_NET_ERRORS_VNET0_INBOUND="0"      # errors/s
NETDATA_NET_ERRORS_VNET0_OUTBOUND="-0"      # errors/s
NETDATA_NET_ERRORS_VNET0_VISIBLETOTAL="0"      # errors/s

# chart: net.vnet0 (name: net.vnet0)
NETDATA_NET_VNET0_RECEIVED="8"      # kilobits/s
NETDATA_NET_VNET0_SENT="1"      # kilobits/s
NETDATA_NET_VNET0_VISIBLETOTAL="9"      # kilobits/s

# chart: elasticsearch_gesmaster.cluster_stats_shards_total (name: elasticsearch_gesmaster.cluster_stats_shards_total)
NETDATA_ELASTICSEARCH_GESMASTER_CLUSTER_STATS_SHARDS_TOTAL_SHARDS="114"      # shards
NETDATA_ELASTICSEARCH_GESMASTER_CLUSTER_STATS_SHARDS_TOTAL_VISIBLETOTAL="114"      # shards

# chart: elasticsearch_gesmaster.cluster_stats_indices (name: elasticsearch_gesmaster.cluster_stats_indices)
NETDATA_ELASTICSEARCH_GESMASTER_CLUSTER_STATS_INDICES_INDICES="114"      # indices
NETDATA_ELASTICSEARCH_GESMASTER_CLUSTER_STATS_INDICES_VISIBLETOTAL="114"      # indices
Note
8.9.1.2. Prerequisites
User : member of Administrator group
8.9.1.3. Preliminary operations
Login to GCenter via a browser (see Connecting to the GCenter web interface via a web browser). with the prerequisite rights.
8.9.1.4. Procedure to access to the `Netdata polling` screen of the legacy web UI
In the navigation bar, click successively on:
The
`Admin`The
`Admin`sub menu`Configuration`commandThe`Configuration`window is displayed.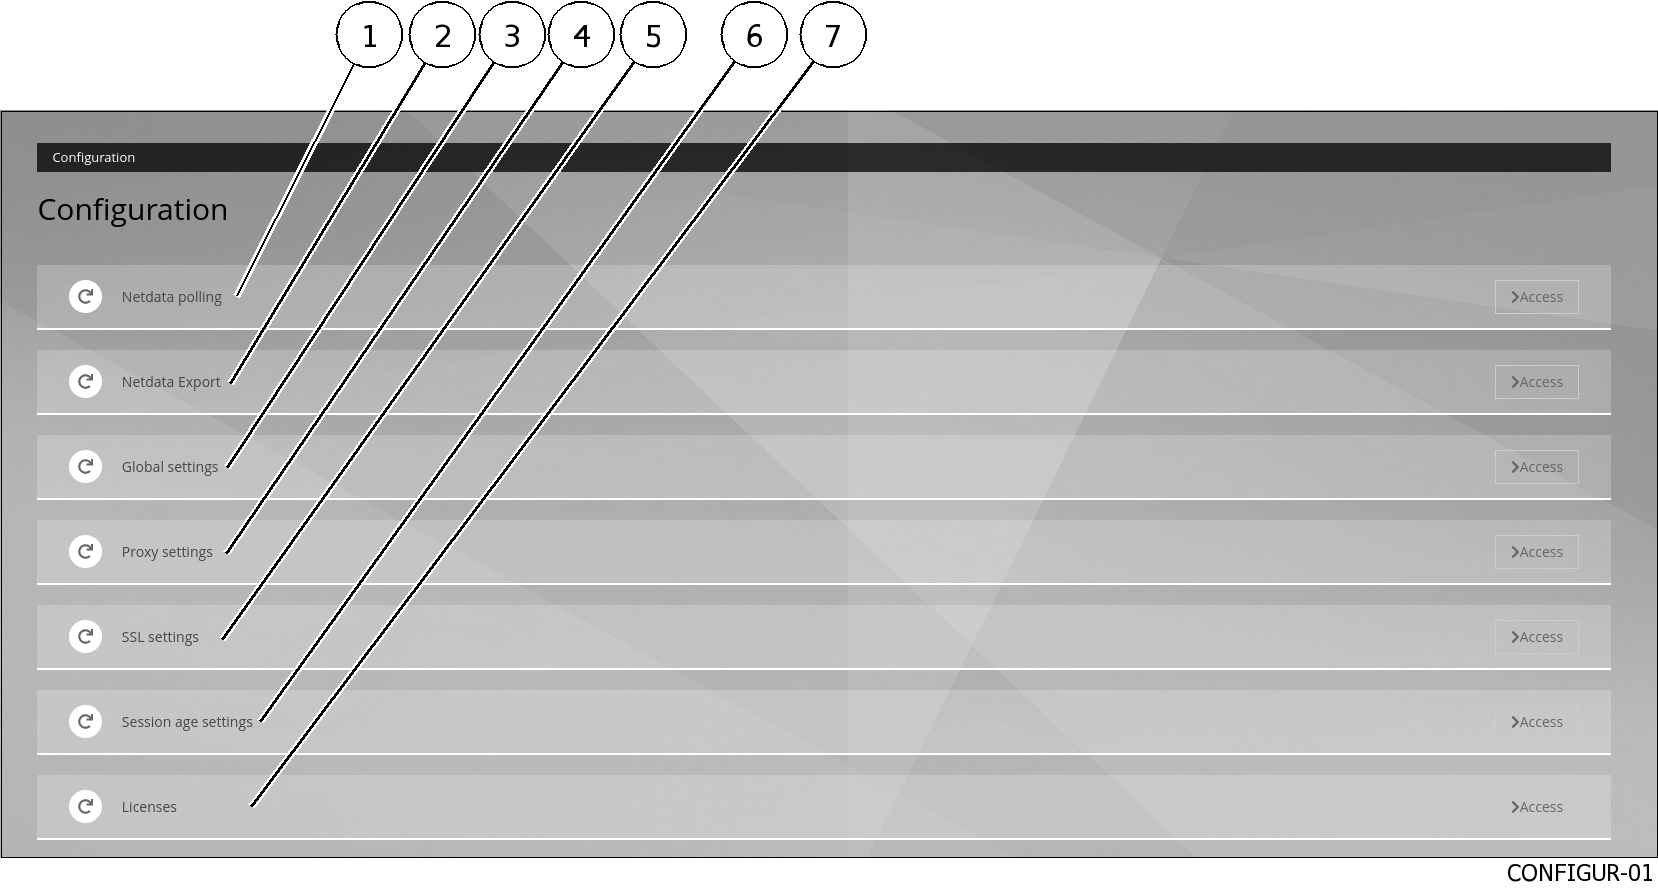
Click on the
`Netdata polling`button (1).
8.9.1.5. Procedure to configure
The following screen is displayed:
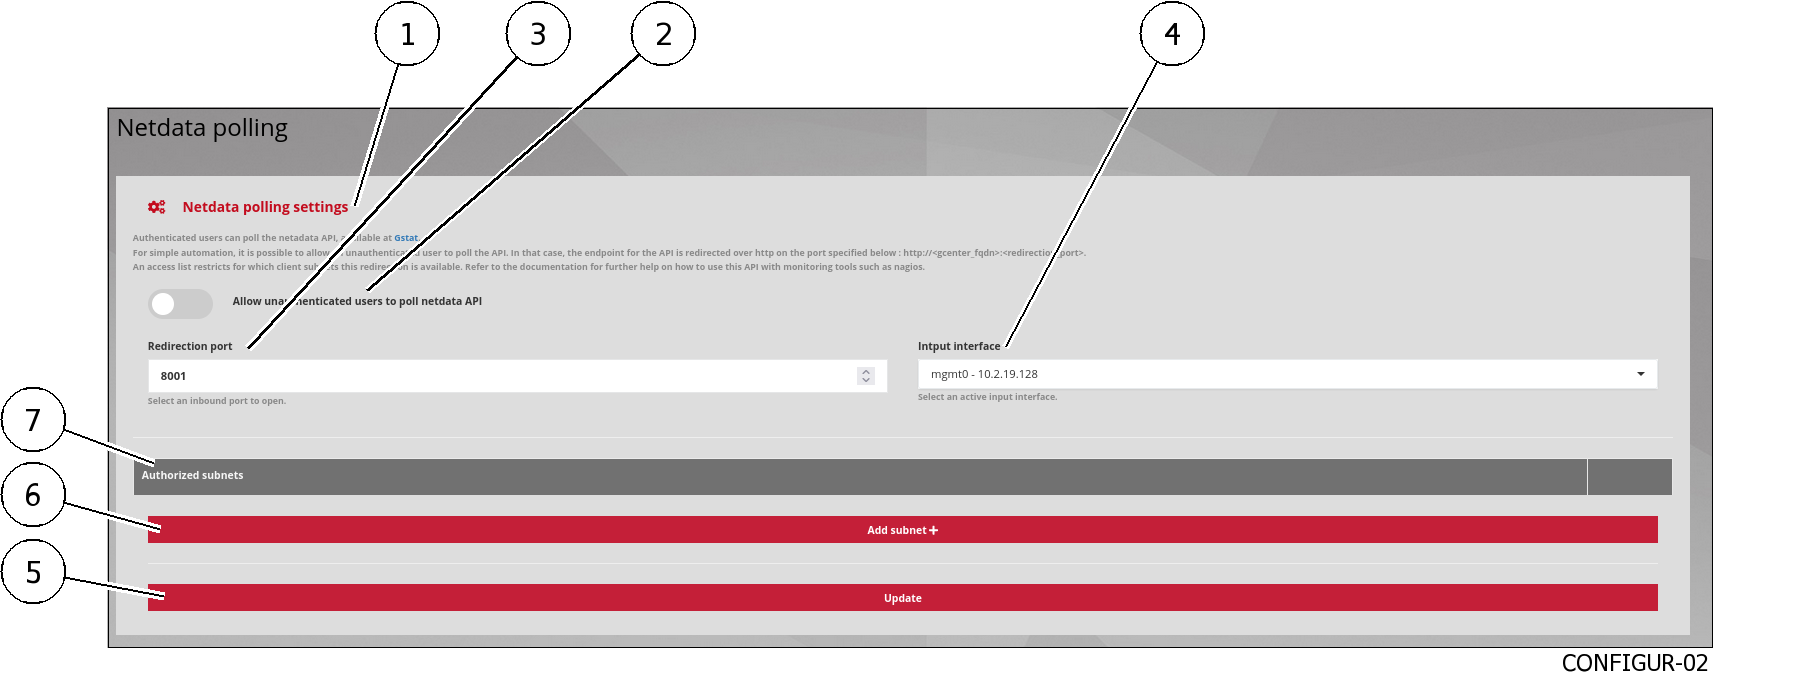
Use the selector (2)
`Allow unauthenticated users to poll netdata API`.Select forwarding port (3): default 8001
Select the GCenter input interface in field (4)
`Intput interface`.To add an IP address or subnet:
Press on the
`Add subnet`buttonIn the
`ADD IP/MASK`window, enter the IP address then`/`then the mask`ADD`buttonThe address entered is displayed in field (7)`Authorized subnets`
- Press on the
`Save`button (5).If all is ok then the message`The Netdata polling configuration was successfully updated`is displayed.