2.1.4. Machine Learning engine
2.1.4.1. Introduction to the DGA Algorithm
2.1.4.1.1. Activation
ML Management menu in the GCenter web interface (`Admin-GCenter- ML Management` screen of the legacy web UI).Note
In v102, only alerts are generated by the engine, unlike in v101 where only DNS metadata was generated.
2.1.4.1.2. Exception lists White List / Black List
2.1.4.1.3. Displaying DGA alerts
DGA alerts are displayed in the NDR web interface as well as in the Kibana dashboards in the ML section.
Note
The Machine Learning engine is labelled "C&C" in the NDR web interface.
`dga_probability` field will be added.Note
If a GCap oversees multiple networks or if multiple GCaps oversee multiple networks, it is possible that a domain name that appears multiple times will only generate one alert.
2.1.4.2. Events generated
- In the main interface named WEB UI of the GCenter in the
`Alerts`tab (the main interface named WEB UI is described in Overview of the WEB UI).To view the alerts, select the filter`C&C`and thus view the list of alerts: see the presentation of the Web UI `Alerts` screen.By clicking on an alert, the detailed information of this alert is displayed: see Example of a DGA alert in the webui. - In the Kibana UI interfaceTo view the alerts, select the filter
`C&C`and thus view the list of alerts: see the presentation of the Web UI `Alerts` screen.By clicking on an alert, select on the command`Alert details`then select the arrow to the left of the alert.The interface displayed is the interface named Kibana UI (described in Overview of the Kibana GUI).The detailed information of this alert can be viewed in table or jason format (see Example of Machine Learning log).
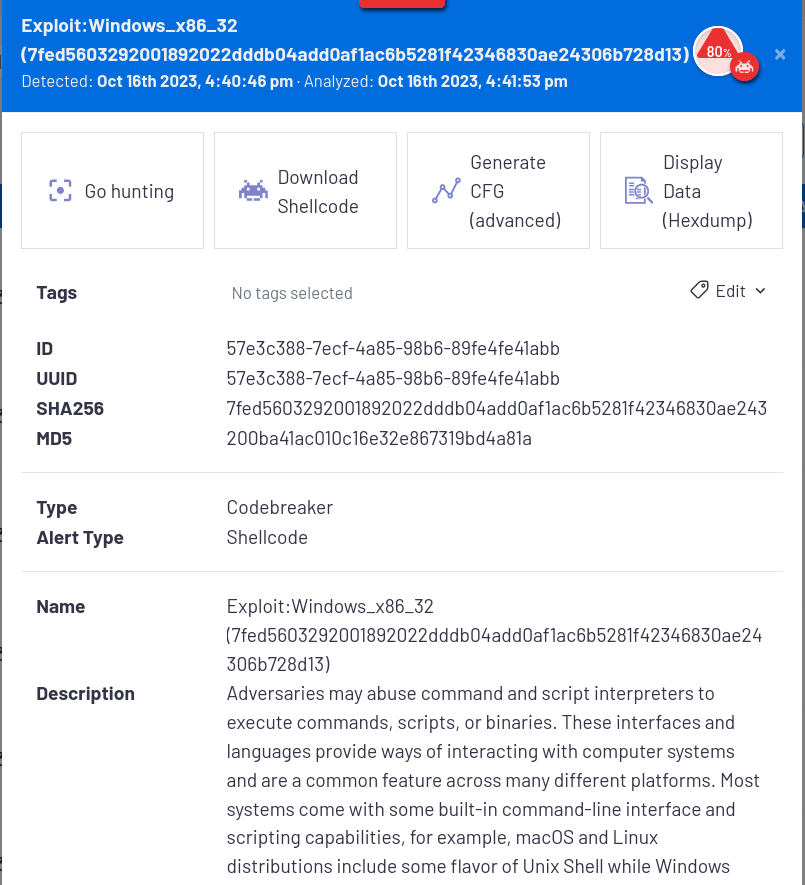
2.1.4.2.1. Example of a DGA alert in the webui
The counters are detailed in Machine learning log data structure.
2.1.4.2.2. Example of Machine Learning log
{
"_index": "machine_learning-2023.10.16-000169",
"_type": "_doc",
"_id": "UQ0COYsBeBoubSyguUoF",
"_version": 1,
"_score": 1,
"_source": {
  "dest_port": 53,
  "@version": "1",
  "domain_name": "nvtcvimt.com",
  "flow_id": 2099102182782245,
  "timestamp_detected": "2023-10-16T15:00:09.568Z",
  "@timestamp": "2023-10-16T15:02:41.646Z",
  "type": "machine_learning",
  "dest_ip": "78.46.218.253",
  "gcenter": "gcenter-int-128-dag.gatewatcher.com",
  "probability": 0.9998979282169229,
  "timestamp_analyzed": "2023-10-16T15:02:41.646Z",
  "src_ip": "192.168.56.104",
  "src_port": 1025,
  "event_type": "dga",
  "severity": 1,
  "gcap": "gcap-int-129-dag.gatewatcher.com",
  "matched_event": "0ebe7d76-ce3b-4623-bdd1-6aa4838b4149",
  "uuid": "819423ea-d328-4c40-a998-eb022e813b19"
},
"fields": {
  "severity": [
    1
  ],
  "probability": [
    0.99989796
  ],
  "gcenter": [
    "gcenter-int-128-dag.gatewatcher.com"
  ],
  "matched_event": [
    "0ebe7d76-ce3b-4623-bdd1-6aa4838b4149"
  ],
  "type": [
    "machine_learning"
  ],
  "uuid": [
    "819423ea-d328-4c40-a998-eb022e813b19"
  ],
  "timestamp_detected": [
    "2023-10-16T15:00:09.568Z"
  ],
  "src_ip": [
    "192.168.56.104"
  ],
  "src_port": [
    1025
  ],
  "domain_name": [
    "nvtcvimt.com"
  ],
  "event_type": [
    "dga"
  ],
  "@timestamp": [
    "2023-10-16T15:02:41.646Z"
  ],
  "flow_id": [
    2099102182782245
  ],
  "dest_ip": [
    "78.46.218.253"
  ],
  "@version": [
    "1"
  ],
  "gcap": [
    "gcap-int-129-dag.gatewatcher.com"
  ],
  "timestamp_analyzed": [
    "2023-10-16T15:02:41.646Z"
  ],
  "dest_port": [
    53
  ]
}
}
2.1.4.2.3. Machine learning log data structure
The logs are composed of different parts:
The leading part
The source part defined by "_source"
The field portion defined by "_fields"
2.1.4.2.3.1. The header part of the Machine learning logs
The header section contains:
{
"_index": "machine_learning-2023.10.16-000169",
"_type": "_doc",
"_id": "UQ0COYsBeBoubSyguUoF",
"_version": 1,
"_score": 1,
Field |
Required |
Description |
Values or example |
|---|---|---|---|
_index |
Yes |
Internal index |
machine_learning-2023.10.16-000169 |
_type |
Yes |
default type |
_doc |
_id |
Yes |
internal identifier |
UQ0COYsBeBoubSyguUoF |
_version |
Yes |
internal version |
1 |
_score |
Yes |
relevance of the response to the request |
1 |
2.1.4.2.3.2. The source part of the Machine learning logs
The source part defined by "_source" contains:
"_source": {
  "dest_port": 53,
  "@version": "1",
  "domain_name": "nvtcvimt.com",
  "flow_id": 2099102182782245,
  "timestamp_detected": "2023-10-16T15:00:09.568Z",
  "@timestamp": "2023-10-16T15:02:41.646Z",
  "type": "machine_learning",
  "dest_ip": "x.x.x.x",
  "gcenter": "gcenter-xxx.domain.local",
  "probability": 0.9998979282169229,
  "timestamp_analyzed": "2023-10-16T15:02:41.646Z",
  "src_ip": "x.x.x.x",
  "src_port": 1025,
  "event_type": "dga",
  "severity": 1,
  "gcap": "gcap-xxx.domain.local",
  "matched_event": "0ebe7d76-ce3b-4623-bdd1-6aa4838b4149",
  "uuid": "819423ea-d328-4c40-a998-eb022e813b19"
},
Field |
Required |
Description |
Values or example |
|---|---|---|---|
@timestamp |
Yes |
Timestamp of the processing of the alert by the GCenter (corresponds to the passage in logstash) |
2023-10-16T15:02:41.646Z |
@version |
yes |
Version of document |
1 |
Alert Type in webui |
Yes |
alert type |
C&C |
Description (in webui) |
yes |
Threat description field. Only present in web ui |
Adversaries can dynamically establish connections to the command and control infrastructure to evade common detections and patches. ... |
dest_ip (or IP in webui) |
Yes |
Destination IP address |
x.x.x.x |
dest_port (or PORTs in webui) |
No |
Port of destination |
53 |
domain_name |
yes |
Domain name |
nvtcvimt.com |
event_type |
Yes |
Type of event |
dga |
flow_id |
Yes |
Unique identifier of the flow. Allows to find the associated fileinfo |
2,099,102,182,782,245 |
gcap |
Yes |
Name of the gcap associated with the alert |
gcap-xxx.domain.local |
gcenter |
Yes |
GCenter name associated with alert. |
gcenter-xxx.domain.local |
Hostname (webui) |
yes |
Host name of the threat originator |
if the hostname is not present, its IP is displayed |
matched_event |
yes |
0ebe7d76-ce3b-4623-bdd1-6aa4838b4149 |
|
MITRE ASSOCIATIONS |
yes |
Threat MITRE category |
Command and Control: Dynamic Resolution |
Name in webui |
Yes |
Sum of information of fields event_type + domain_name |
DGA:vmfyaxnse.com |
probability |
yes |
Likelihood of this being the identified threat |
0.9998979282169229 |
severity |
Yes |
Analysis result code. |
Between 0 and 3.
0=clean, 1=infected, 2=suspicious, 3=Other
|
src_ip (or IP in webui) |
Yes |
Source IP address detected by Sigflow |
X.X.X.X |
src_port (or PORTs in webui) |
Yes |
Source port detected by Sigflow |
1025 |
timestamp analyzed |
Yes |
Date and time of last file scan |
2023-10-16T15:02:41.646Z |
timestamp detected |
Yes |
Timestamp of file capture by Gcap |
Oct 16, 2023 @ 17:00:09.568 |
type |
Yes |
Type of event |
machine_learning |
uuid or id |
Yes |
Unique identifier of the alert |
819423ea-d328-4c40-a998-eb022e813b19 |
2.1.4.2.3.3. The fields part of the Machine learning logs
The field part defined by "fields" contains the same counters as in the source part: refer to the source part section.
2.1.4.3. Viewing the state of machine learning
The current motor state is displayed in the Web UI `Health checks` screen.
2.1.4.4. Machine Learning Update
The engine does not receive an update.
2.1.4.5. Machine Learning Setup
The engine is not configurable but this engine must be enabled to detect DGAs (C&C) (see `Admin-GCenter- ML Management` screen of the legacy web UI).