8.6.3. Export data to a ETL Logstash via the syslog protocol
8.6.3.1. Introduction
On the GCenter, configure data export:
On the Logstash server, configure the flow receiving pipeline from the GCenter (see Procedure to be performed on the server)
Note
8.6.3.2. Prerequisites
User : member of Administrator group
8.6.3.3. Preliminary operations
Login to GCenter via a browser (see Connecting to the GCenter web interface via a web browser).
8.6.3.4. Procedure to access the `Data exports` window for an administrator account
In the navigation bar, click successively on:
The
`Admin`buttonThe
`Gcenter`sub menu`Data exports`commandThe`Data exports`window is displayed.
8.6.3.5. Procedure to setup the general parameters
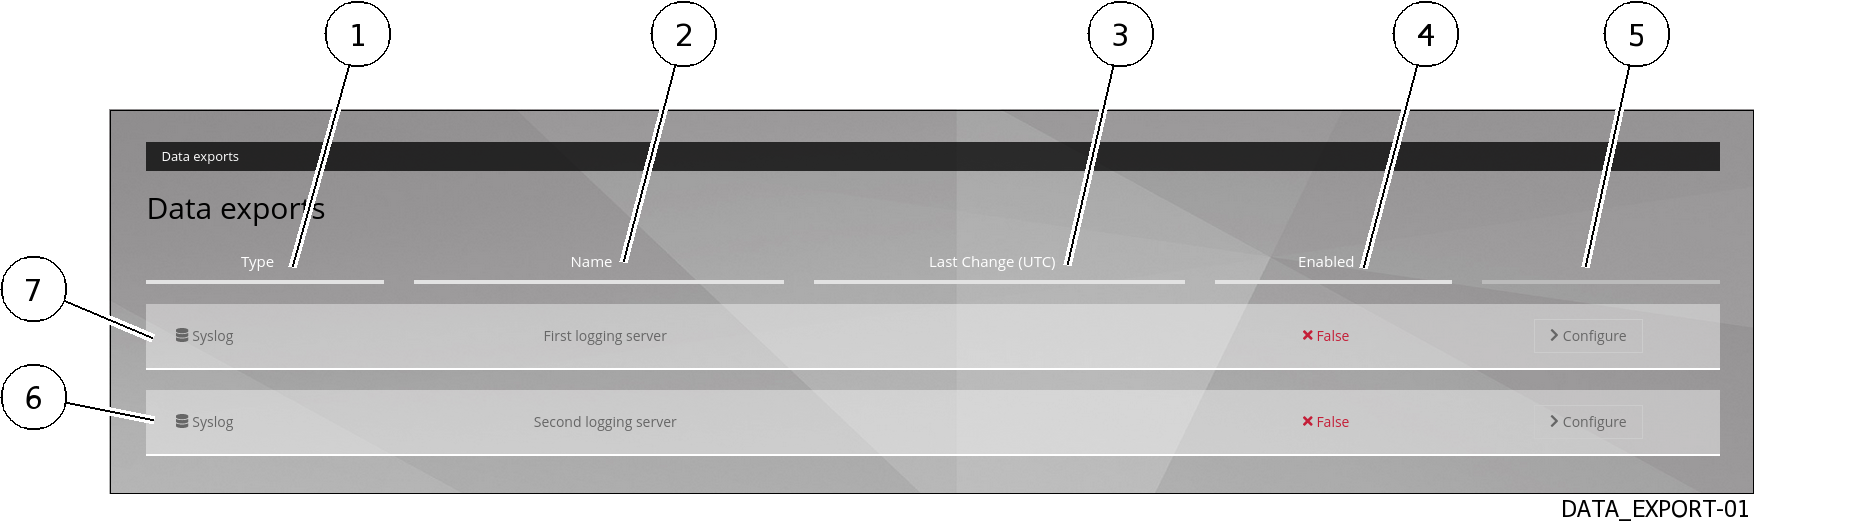
- Click the
`Configure`button (5) on one of the two connections (6 or 7) to be configured.The`Syslog data export`window opens.
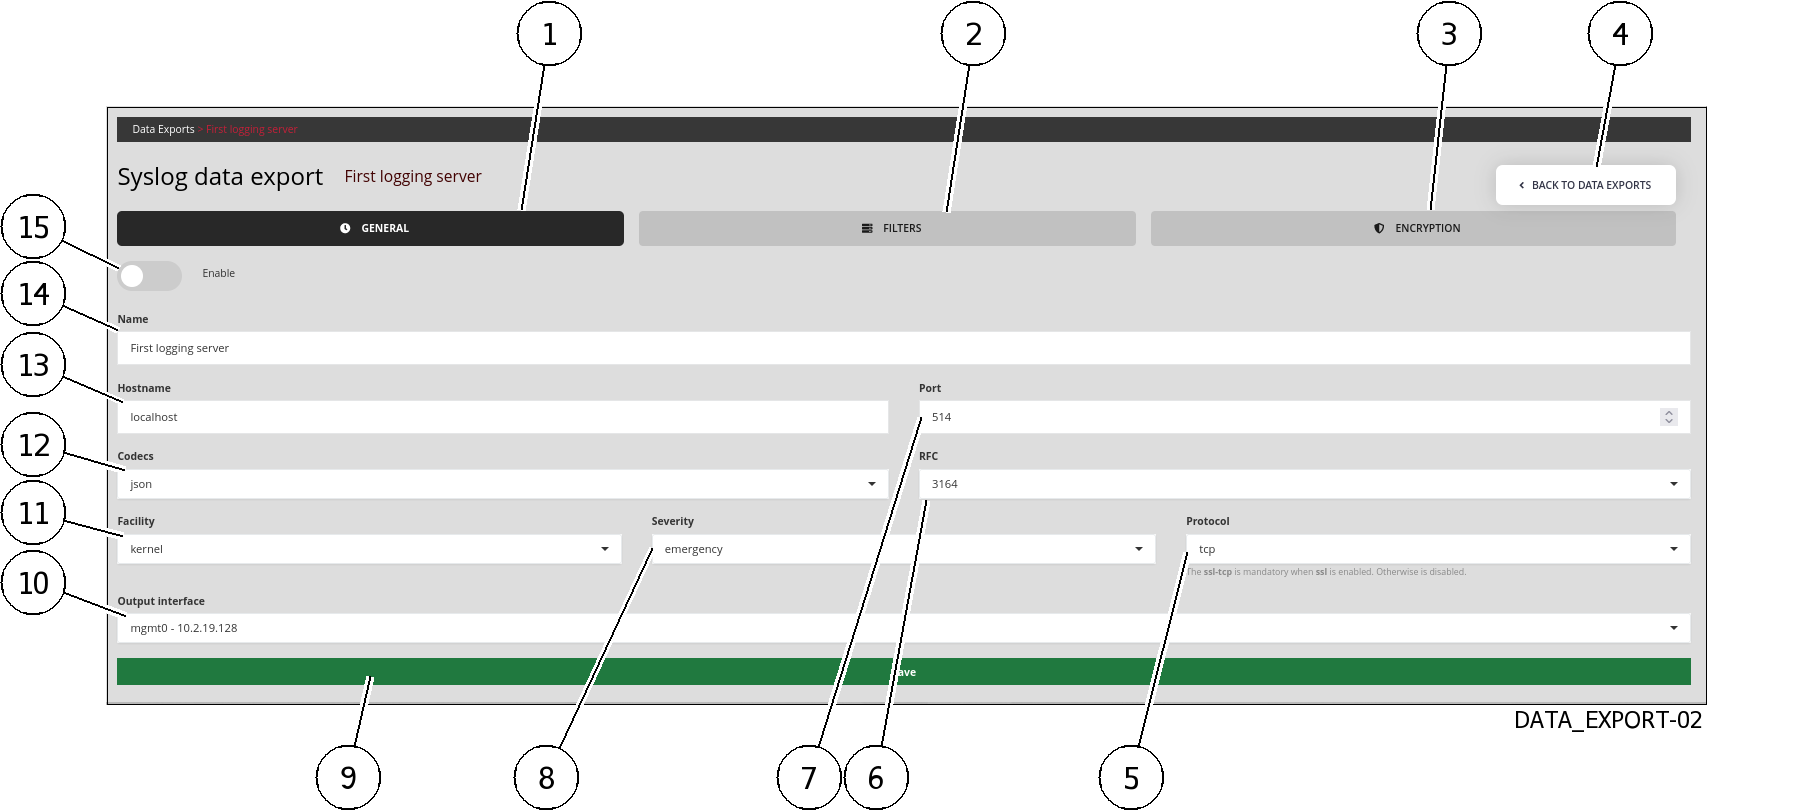
Click on
`GENERAL`tab (1).
Note
Values with a $VALUE format are context-specific and are noted as such so that they can be referenced in the rest of the documentation.
Enter parameters using the following table:
Item
Parameter
Description
Value
15
Enable
Activate this export pipeline
Activated
14
Name
Syslog export name
$SYSLOG_NAME
13
Hostname
Logstash server DNS name or IP address
$LOGSTASH_IP
7
Port
destination port
$LOGSTASH_PORT
12
Codecs
Codec used for export
JSON
6
RFC
Standard used by the codec
3164
11
Facility
Syslog header
`facility`default kernel; header will be removed by the reception pipeline
8
Severity
Value of
`severity`in the Syslog headeremergency by default; the header will be deleted by the reception pipeline
5
Protocol
The transport protocol used. TCP or UDP can be used
$PROTOCOL
10
Output interface
Choose the GCenter interface used for Syslog export
$GCENTER_IFACE
- Validate using button (9)
`Save`.The following message indicates that the update has been completed:`Updated with success`.
8.6.3.6. Procedure to setup the filtration parameters
Click on the
`FILTERS`tab (2).
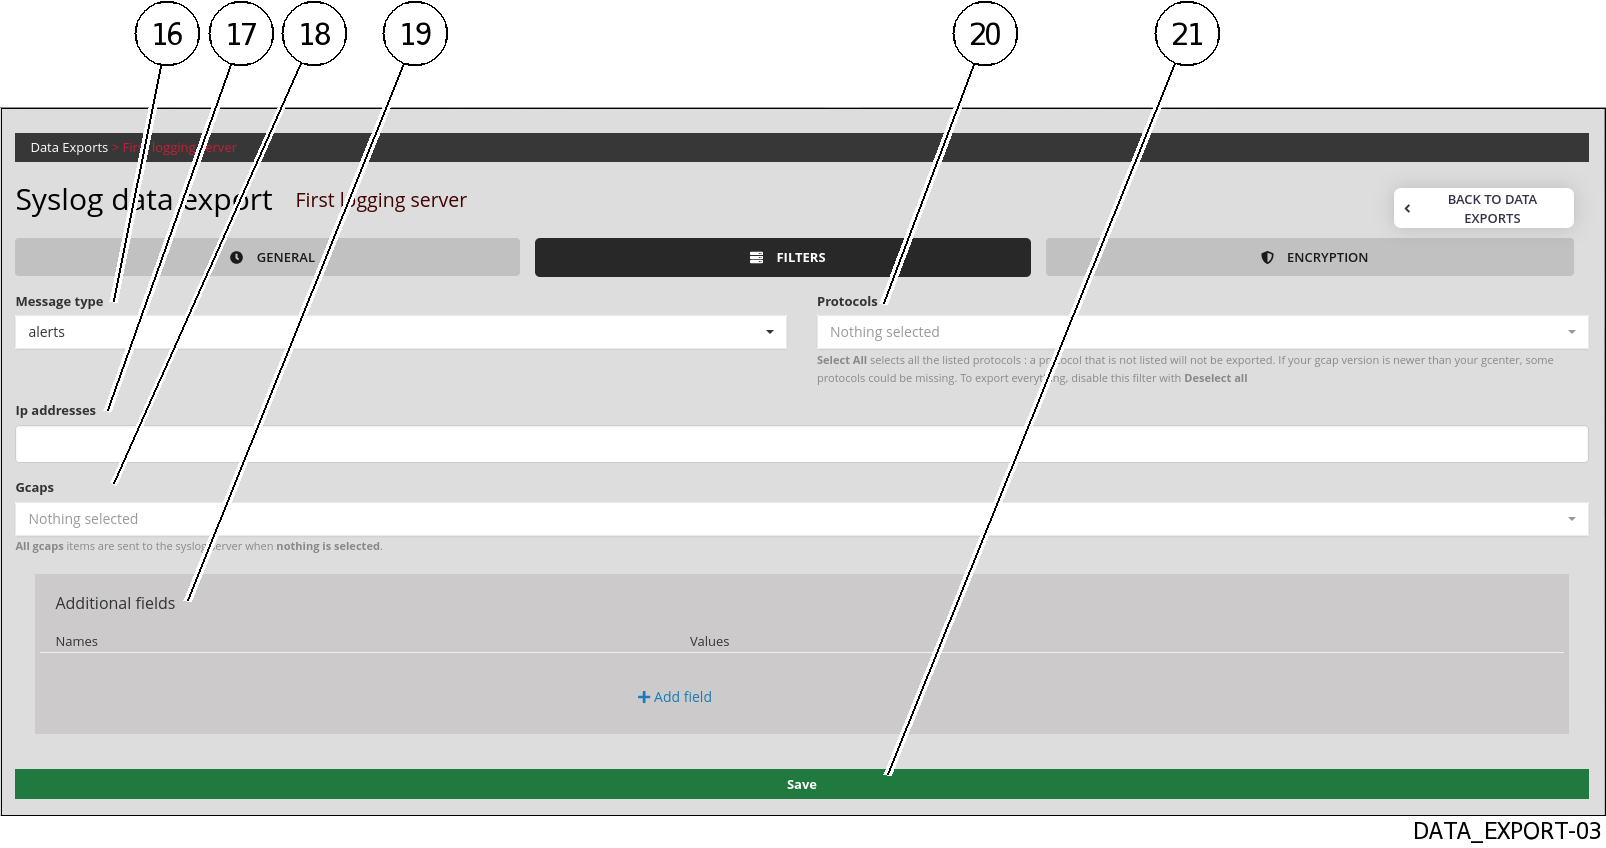
Enter parameters using the following table:
Item
Parameter
Description
16
`Message type`Defines the type of event to send to the remote server. Either only alerts or alerts and metadata (Example: alerts, all)
17
`Ip addresses`Filter by IP or networks. By default, all data is sent to the remote server if the field is empty
18
`Gcaps`Filter by GCap. By default, all GCap data paired to GCenter is sent to the remote server if nothing is selected (Example: GCap1, GCap2)
19
`Additional fields``Name`) and a description (`Values`) can be entered in this window.In the case of using the idmef codec, this field is not supported.20
`Protocols`21
`Save`Changes are only taken into account after pressing the
`Save`button.Note
`Select All`selects all the protocols listed: a protocol that is not selected will not be exported.If GCap is newer than GCenter, some protocols may be missing.To export everything, disable this filter with`Deselect all`.
- Validate using button (21)
`Save`.The following message indicates that the update has been completed:`Updated with success`.
8.6.3.7. Procedure to configure encryption settings
8.6.3.8. Procedure to be performed on the server
Configure the flow receiving pipeline from GCenter.
8.6.3.8.1. Pipeline Logstash
yaml
input {
  syslog {
    port => $LOGSTASH_PORT
    type => syslog
    grok_pattern => '^<%{NUMBER:syslog_priority}>(?:1 |)(?:%{SYSLOGTIMESTAMP:syslog_timestamp}|%{TIMESTAMP_ISO8601:syslog_timestamp}) %{SYSLOGHOST:syslog_hostname} (?:gatewatcher\[-\]:|gatewatcher - - \[-\]) %{GREEDYDATA:syslog_message}\n$'
  }
}
yaml
filter {
  prune {
    whitelist_names => [ "syslog_message" ]
  }

  json {
    source => "syslog_message"
  }

  mutate {
    remove_field => [ "@version","syslog_message" ]
  }

}
yaml
output {
  file {
    path => '/usr/share/logstash/data/output/%{[type]}-%{+YYYY.MM.dd}.log'
    codec => json_lines
  }
}