5.6.1. Web UI `Home` screen

After pressing one of the `HOME` or `GATEWATCHER` buttons on the navigation bar, the `Home` screen is displayed.
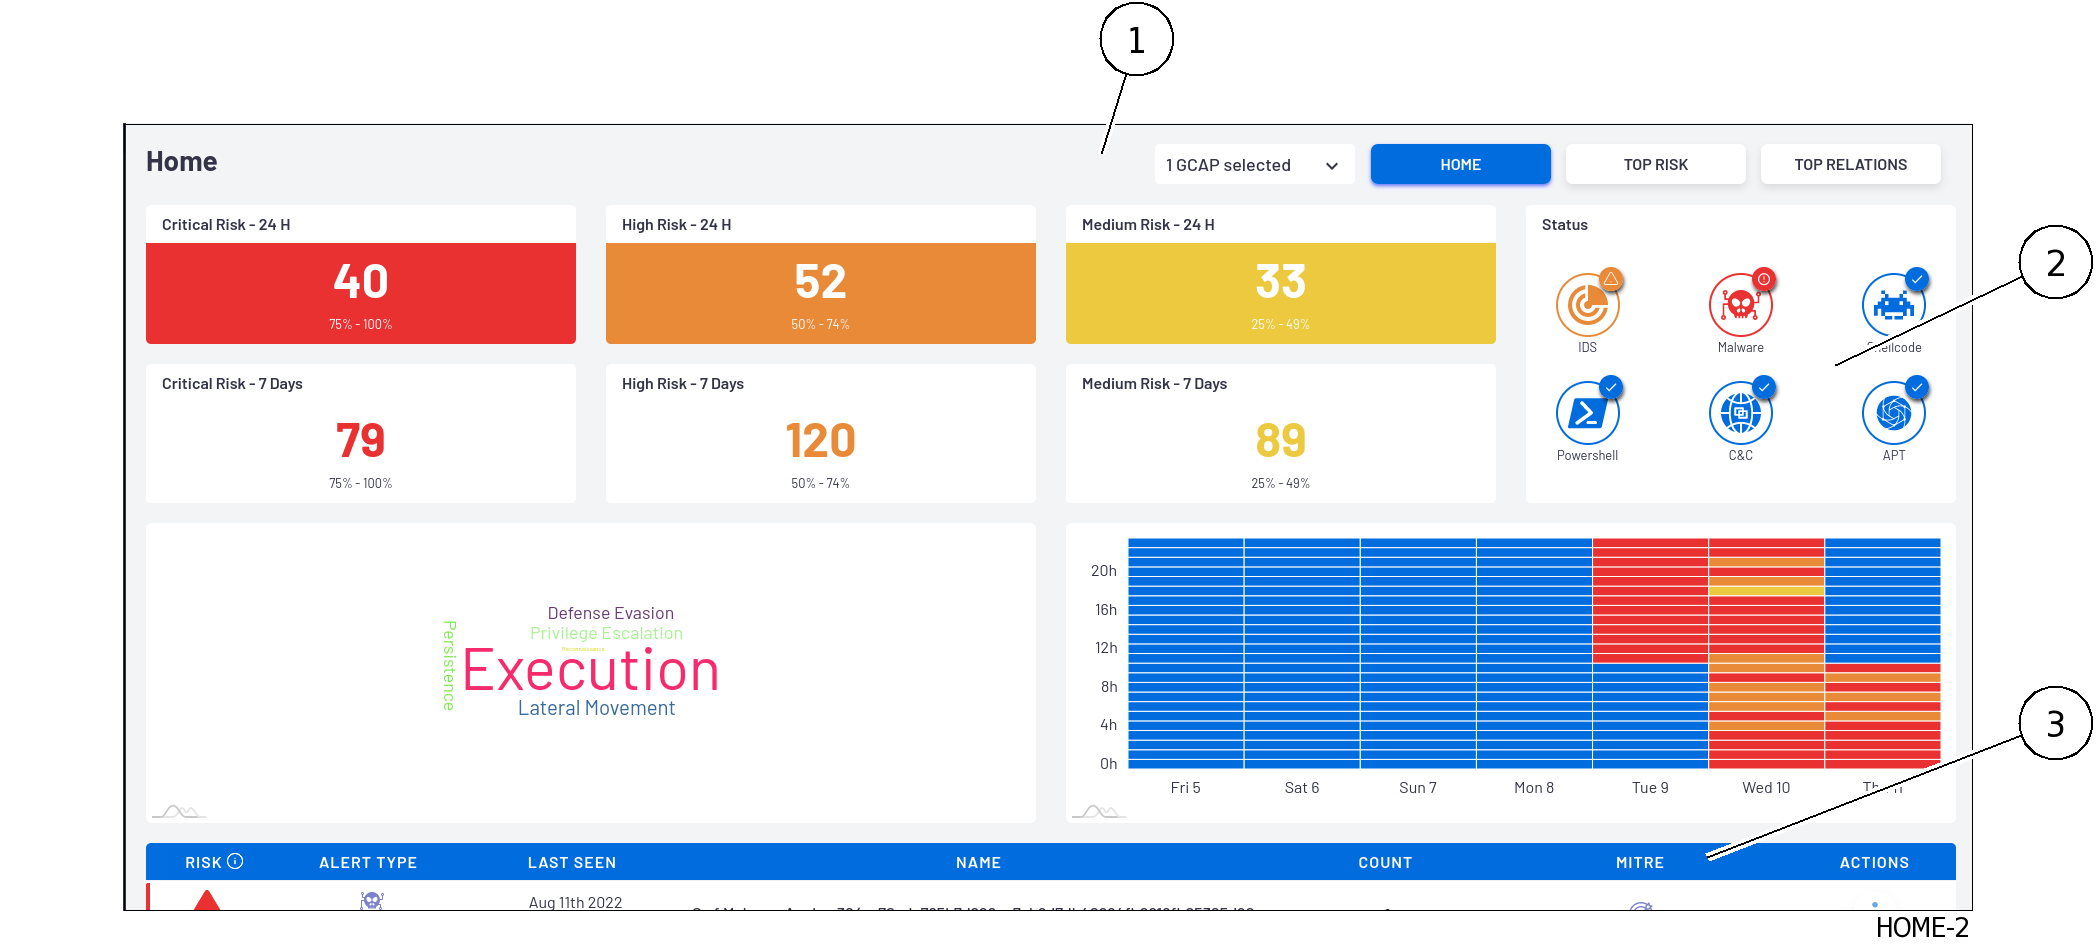
It includes the following items:
../../_images/HOME-2.PNG

Item

Description

1

`Home` screen dashboard selector

2

`Home` screen display area

3

`Home` screen message area


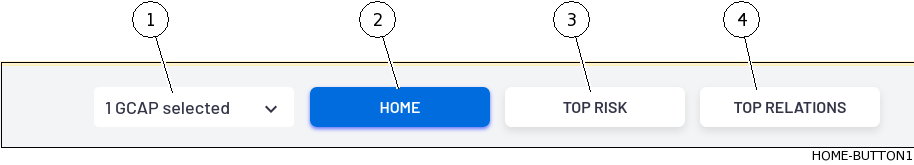
5.6.1.1. `Home` screen dashboard selector

The screen displays a set of:

  • A button to select the GCap whose information is displayed

  • Three buttons to set the theme of the items displayed

../../_images/HOME-BUTTON1.PNG

Item

Name

Description

see description

1

Display of selected GCaps

Selection of GCaps

2

`HOME`

Selection of the default display

see below

3

`TOP RISK`

Selection of the main risk screen

Web UI `Top risk` screen

4

`TOP RELATIONS`

Selection of the main relationships screen

Web UI `Top Relations` screen


5.6.1.2. `Home` screen display area

After pressing one of the `HOME` or `GATEWATCHER` buttons, the display area looks like this:
../../_images/HOMECENTRAL.PNG
The display shows the information of the selected GCap(s) (7).
The screen provides a summary of the detection status:
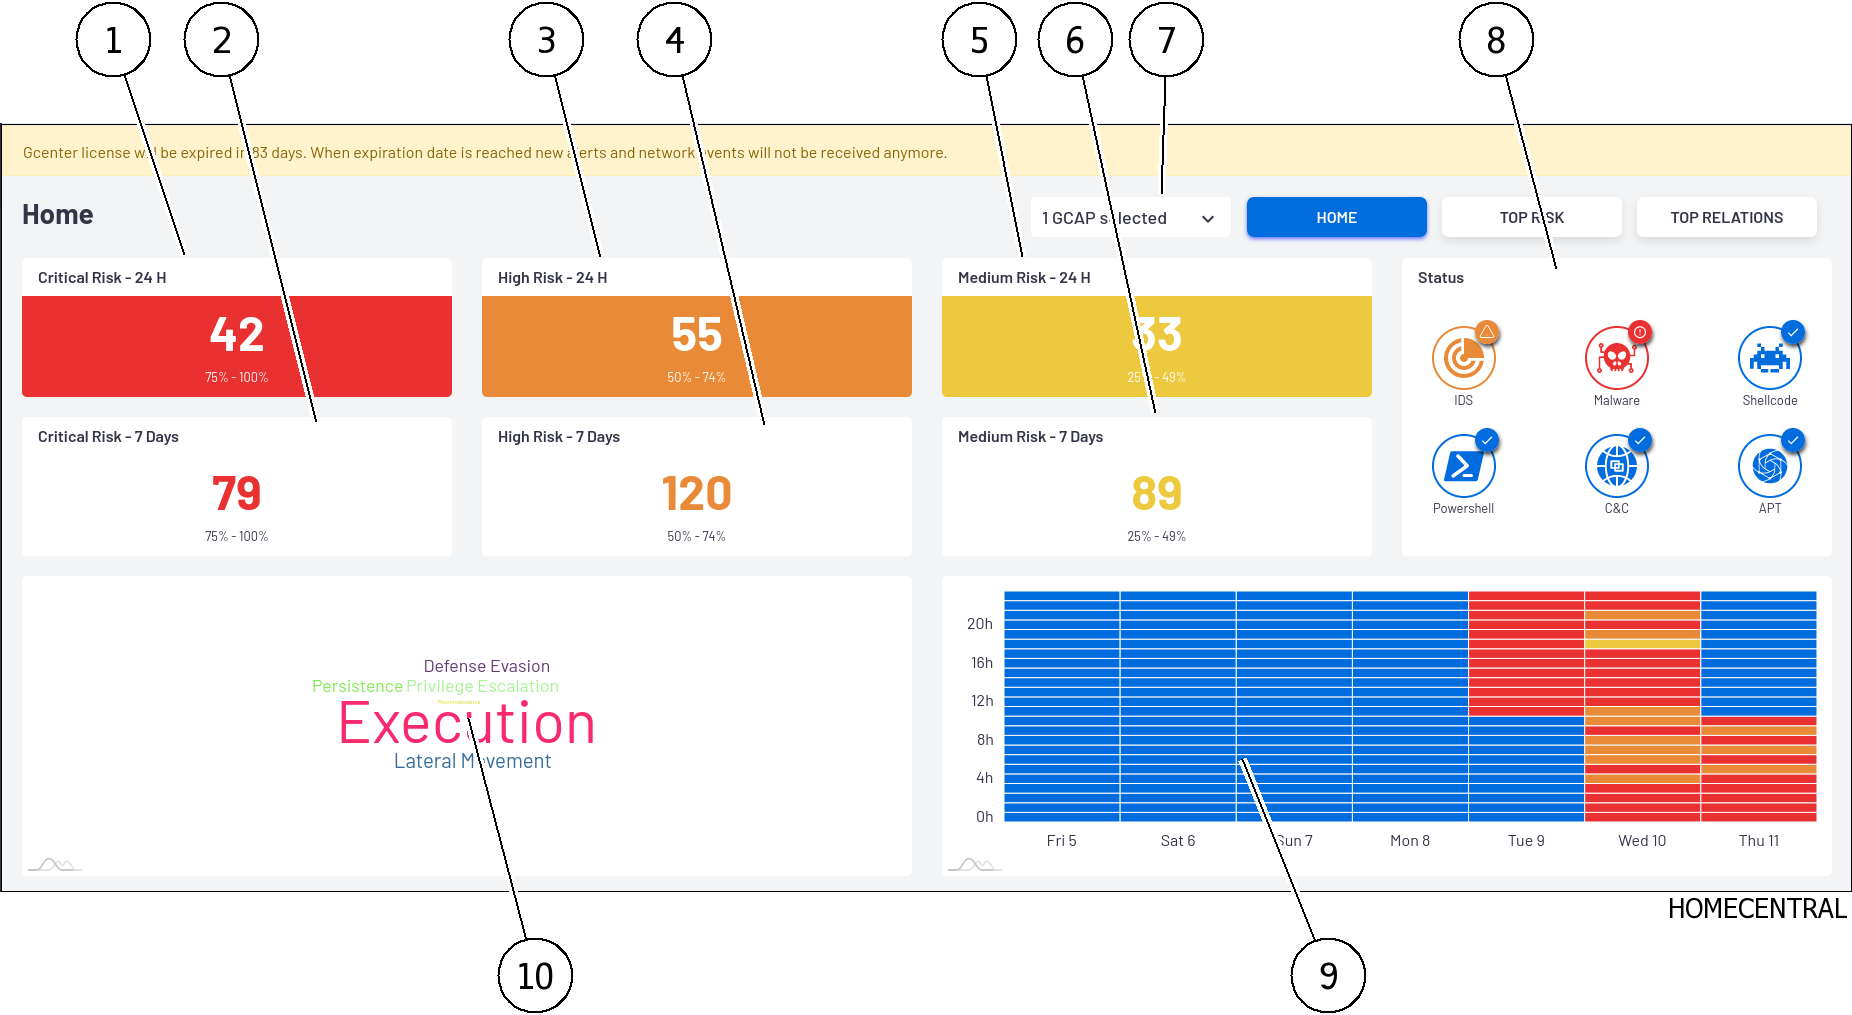
  • The area indicating the number of potential risks by level and date (item 1 to 6)
    These elements forming this zone are listed below:
  • Risk counters classified as Critical risk :

  • Definition of a critical risk: very suspicious activity was detected. Dangerous activity was detected. There is a high probability that your organization is facing a serious threat and counter-meseares should be taken immediately.
    For example, a user downloaded malware or an active network element contacted a known command and control domain.
  • Definition of the color used for this type of alarms in the Web UI: red
  • Risk level of this category: 75 to 100%

Benchmark

Engine

State

1

`Critical risk`
`24h`
Counter giving the number of risks critical appeared in the last 24 hours
If you press this counter, then the system displays the detailed list of each of these risks (Alerts screen)

2

`Critical risk`
`7 days`
Counter giving the number of risks critical appeared in the last 7 days
If you press this counter, then the system displays the detailed list of each of these risks (Alerts screen)
  • Risk counters classified as High risk :

  • Definition of a high risk: a very suspicious activity has been detected. This type of event should be investigated promptly as it could be a sign of significant compromise.
    It is possible that this event is a false positive or related to a bad representation in the network.
  • Definition of the color used for this type of alarms in the Web UI: orange
  • Risk level in this category: 50-74%

    Benchmark

    Engine

    State

    3

    `High risk`
    `24h
    Counter giving the number of risks high appeared in the last 24 hours
    If you press this counter, then the system displays the detailed list of each of these risks (Alerts screen)

    4

    `High risk`
    `7 days`
    Counter giving the number of risks high appeared in the last 7 days
    If you press this counter, then the system displays the detailed list of each of these risks (Alerts screen)
  • Risk counters classified as Medium risk:

  • Definition of a medium risk: an activity that could be related to a threat has been detected.
    The risk has been established at low values because the potential threat does not appear critical or because the probability of false is high.
  • Definition of the color used for this type of alarms in the Web UI: yellow
  • Risk level in this category: 25-49%

    Benchmark

    Engine

    State

    5

    `Medium risk`
    `24h`
    Counter giving the number of risks average appeared in the last 24 hours
    If you press this counter, the system displays the detailed list of each of these risks (Alerts screen).

    6

    `Medium risk`
    `7 days`
    Counter giving the number of risks average appeared in the last 7 days
    If you press this counter, the system displays the detailed list of each of these risks (Alerts screen).
  • Risks classified as low risk have no counter displayed:

  • Definition of a low risk: unusual activity has been detected. This could mean that you have unusual network policies or uses.
    These types of events should be mentioned last because they are not a direct sign of significant compromises.
  • Definition of the color used for this type of alarms in the Web UI: blue
  • Risk level for this category: 0-24%
  • The engine condition zone (8).
    If you press this area, then the system displays the `Health Checks` page (see Web UI `Health checks` screen).
  • The area indicating the date of detection (9): this calendar indicates when potential threats have been detected.
  • The MITRE association area (10).
    If pressed, then the system displays the `Alerts` MITRE filtering page (see Web UI `Alerts` screen).

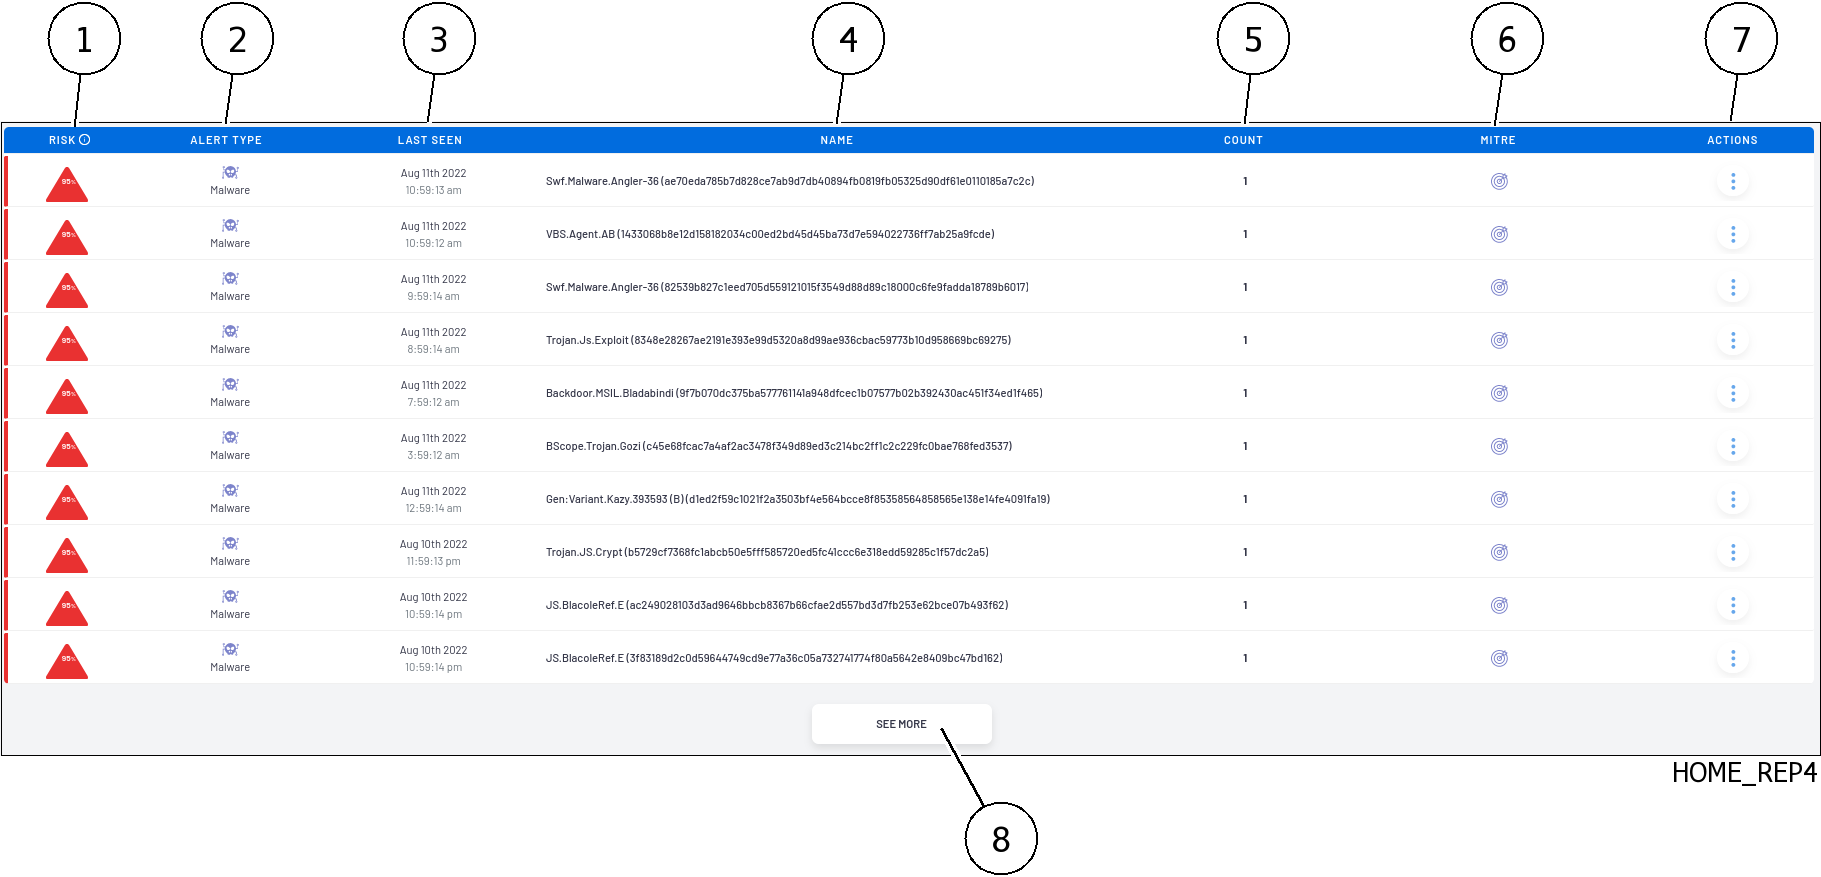
5.6.1.3. `Home` screen message area

../../_images/HOME_REP4.PNG
The list of messages displays the 10 aggregate threats with the highest level of risk.
This area gives the following information:

Benchmark

Name

Description

1

`RISK
If you press the i icon then the system displays the risk definition and the corresponding color

2

`ALERT TYPE`
Alert type (malware, shellcode, IDS, powershell, etc.)

3

`LAST SEEN`
Date and time of last appearance
If pressing the threat then the Alerts window displays threats with the same infection

4

`NAME`
Name of alert
If you press this field then the Alerts window displays threats with the same infection as the selected infection

5

`COUNT`
Number of alarm occurrences

6

`MITRE`
Type of threat icon: see paragraph MITRE Icons

7

`ACTIONS`
Displays sub menu `ACTIONS`
For a malware threat, the possible action is `Files transactions`. This command opens a Kibana window in the `Malcore` tab.
For a Shellcode threat, the possible action is `Go Hunting`. This command opens a Kibana window in the `Codebreaker` tab.
Pressing a threat opens the `Alerts` window that displays threats with the same infection as the selected infection
The button (8) `SEE MORE` displays information on the `Alerts` page (see Web UI `Alerts` screen).

5.6.1.3.1. MITRE Icons

In the MITRE column, the following icons can be displayed:

Icon

Name

Description of threat type

see more information

../../_images/execution.png

Execution

Opponent is trying to execute malicious code.

https://attack.mitre.org/versions/v10/tactics/TA0002/

../../_images/persistence.png

Persistence

Opponent trying to maintain hold

https://attack.mitre.org/versions/v10/tactics/TA0003/

../../_images/privilege.png

Privilege Escalation

Opponent trying to get higher level permissions

https://attack.mitre.org/versions/v10/tactics/TA0004/

../../_images/defense.png

Defense Evasion

The opponent tries to avoid being detected.

https://attack.mitre.org/versions/v10/tactics/TA0005/

../../_images/lateral.png

Lateral Movement

The opponent tries to move around your environment.

https://attack.mitre.org/versions/v10/techniques/T1210/