5.6.5. Web UI `Overview` screen
`Overview` buttons on the navigation bar, the `Overview` screen is displayed.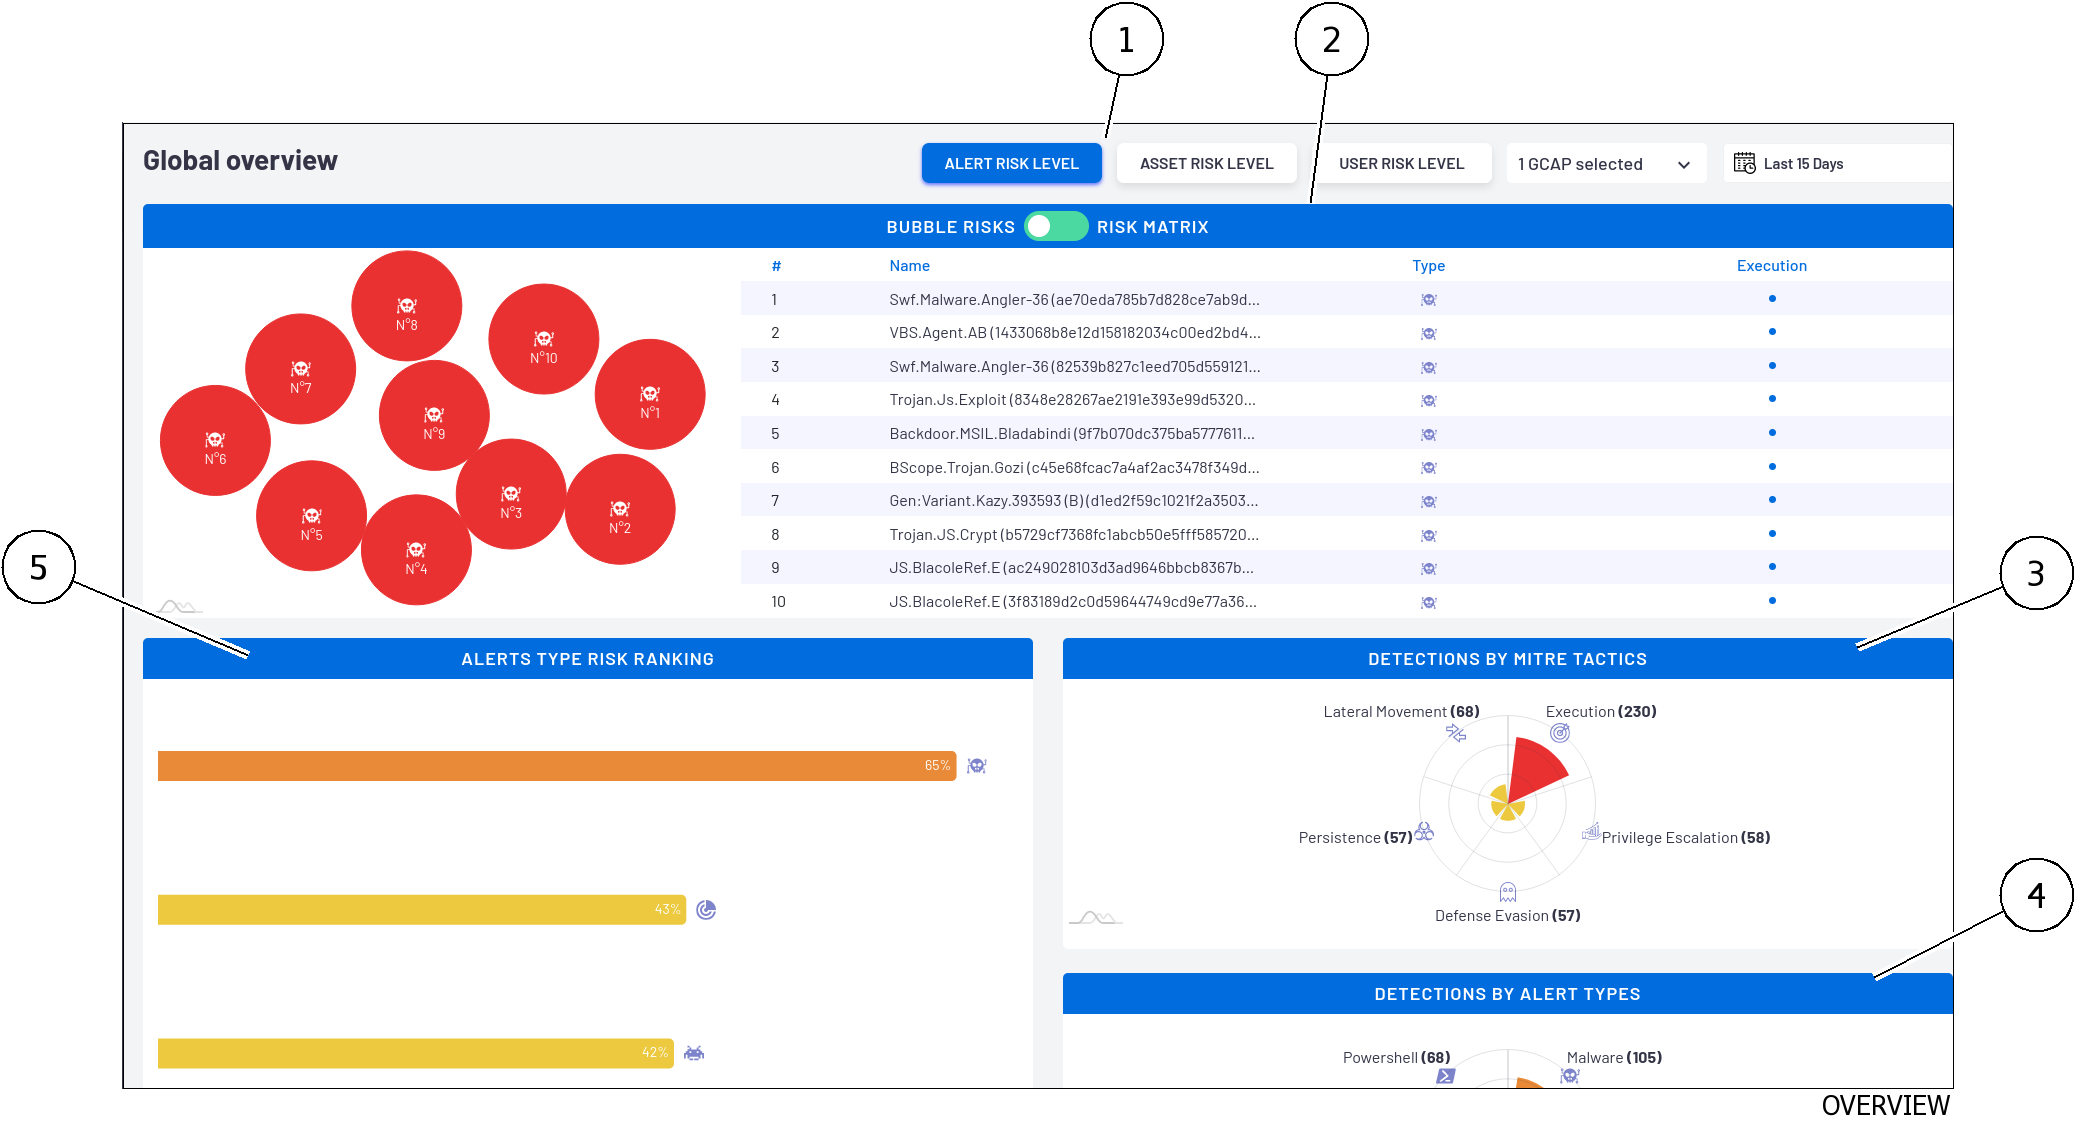
Item |
Description |
|---|---|
1 |
|
2 |
|
3 |
`DETECTIONS BY ALERTE TACTICS` zone of the `Overview` screen |
4 |
|
5 |
5.6.5.1. `Overview` screen : dashboard selector
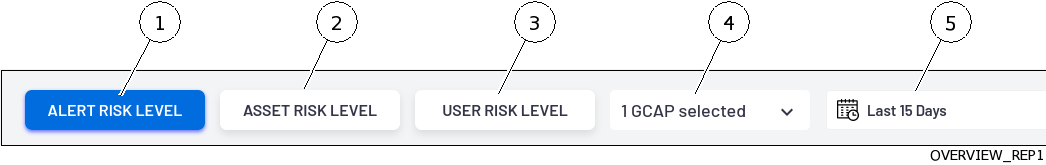
The screen displays a set of:
One button (4) to select the GCap(s) whose information is displayed
One button (5) for the period for which the information is displayed
Three buttons (1 to 3) to define the theme of the dashboards displayed on this page
Item |
Name |
Description |
|---|---|---|
1 |
|
Alert Risk Level. Defines |
2 |
|
Risk level of assets. Defines the |
3 |
|
User Risk Level . Defines the |
4 |
GCAP selector |
Selection of GCap |
5 |
Time period selector |
Selection of the display period |
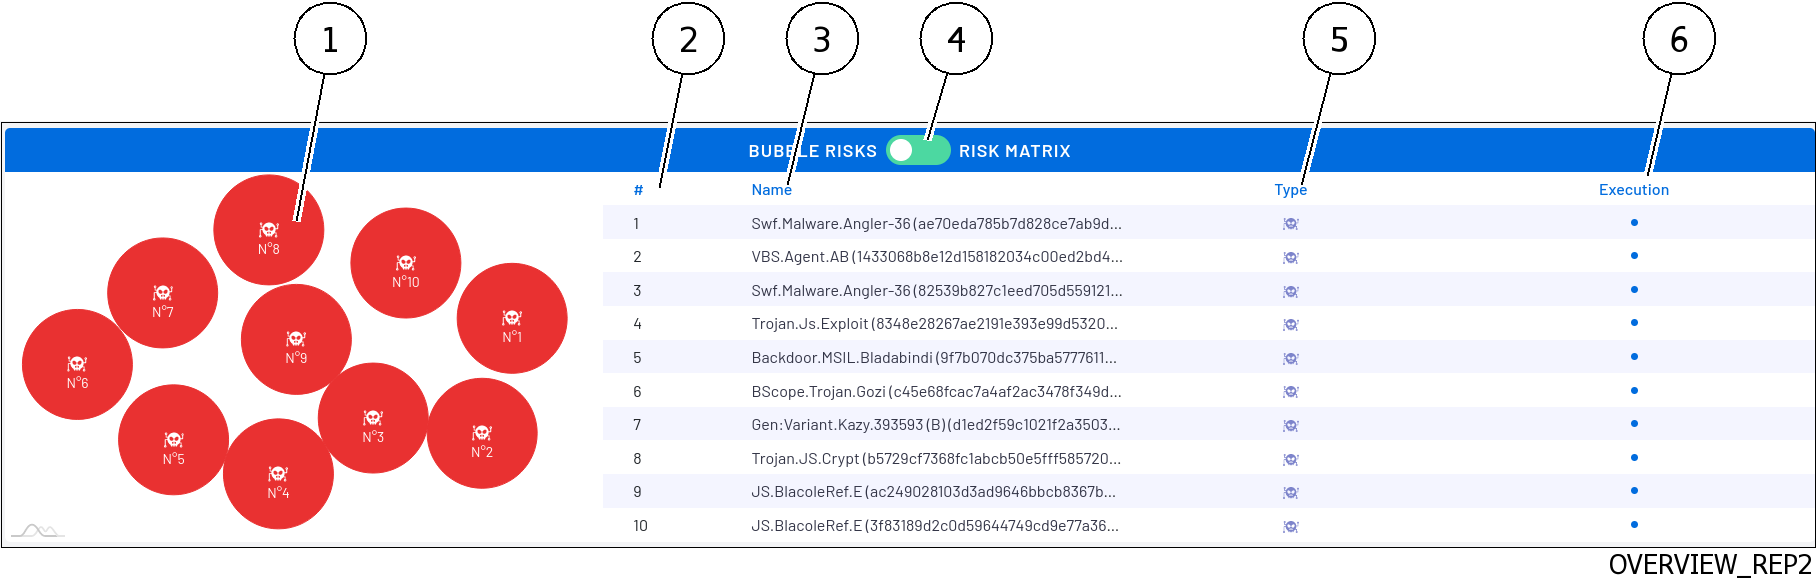
5.6.5.2. `Overview` screen alerts list display area
The display of the alerts is possible in 2 ways selectable by the button (4):
Display
`BUBBLE RISKS`Display
`RISK MATRIX`
For the ALERTS theme, the `BUBBLE RISKS` display consists of:
Item |
Description |
|---|---|
1 |
Bubble zone. Each element (here an alert) is displayed as a bubble.
Each item is numbered and corresponds to the list displayed next to it.
By hovering over an element, a window gives additional information.
- Number, not Alert
- Risk: percentage level of risk
- Alert counter
- type of MITRE alerts
|
2 |
Alert number |
3 |
Name of detected threat
By hovering over an element, a window gives the same additional information.
By clicking on the name, the system displays the
`Alerts` screen for the selected threat for more information. |
4 |
Display change button (bubbles/matrix) |
5 |
Type field: type of risk (malware...) |
6 and following |
Each column indicates the category MITRE (
`Execution`, `Persistence`, `Privilege Escalation`, `Defense Evasion`, `Lateral Movement`).Each point defines the threat category.
|
5.6.5.3. `DETECTIONS BY MITRE TACTICS` zone of the `Overview` screen
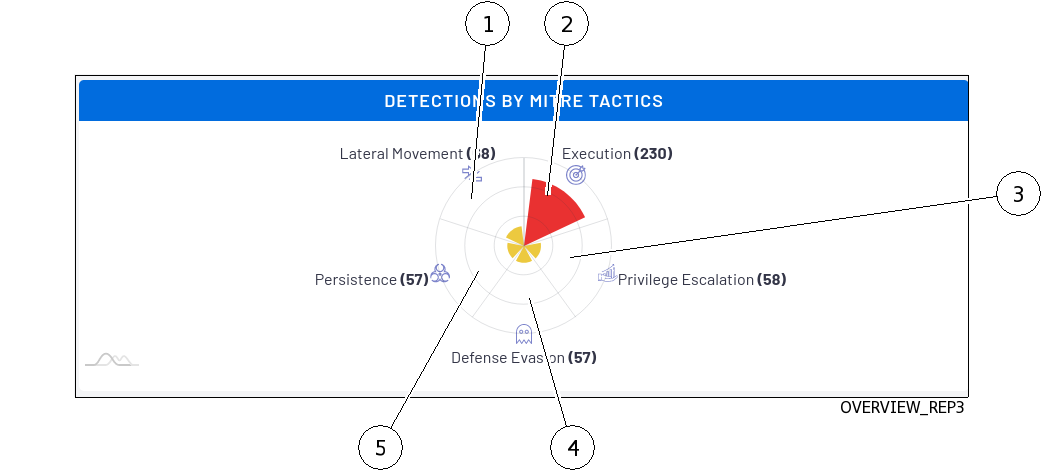
The system displays the distribution of risks between the following categories in a circular fashion:
Benchmark |
Name |
Description |
|---|---|---|
1 |
|
Number of lateral movements |
2 |
|
Number of threats executed |
3 |
|
Number of privilege escalation |
4 |
|
Number of defensive escapes |
5 |
|
Number of persistent threats |
Note
Depending on the threat, only the categories present are displayed.
5.6.5.3.1. MITRE Icons
In the MITRE column, the following icons can be displayed:
5.6.5.4. `DETECTIONS BY ALERTE TACTICS` zone of the `Overview` screen
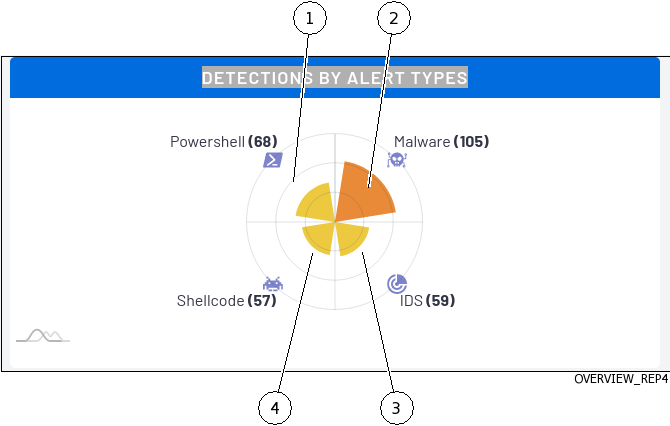
The system displays a circular risk breakdown between the following categories:
Benchmark |
Name |
Description |
|---|---|---|
1 |
|
Number of powershells detected |
2 |
|
Number of shellcodes detected |
3 |
|
Number of malware detected |
4 |
|
Number of IDS detected |
5.6.5.5. `ALERTS TYPE RISK RANKING` zone of the `Overview` screen
The system displays the risks:
Grouped by type of alert
Sorted by decreasing risk level
The type of alert
The percentage of risk
The number of alerts
`Alerts` screen for the selected risk type.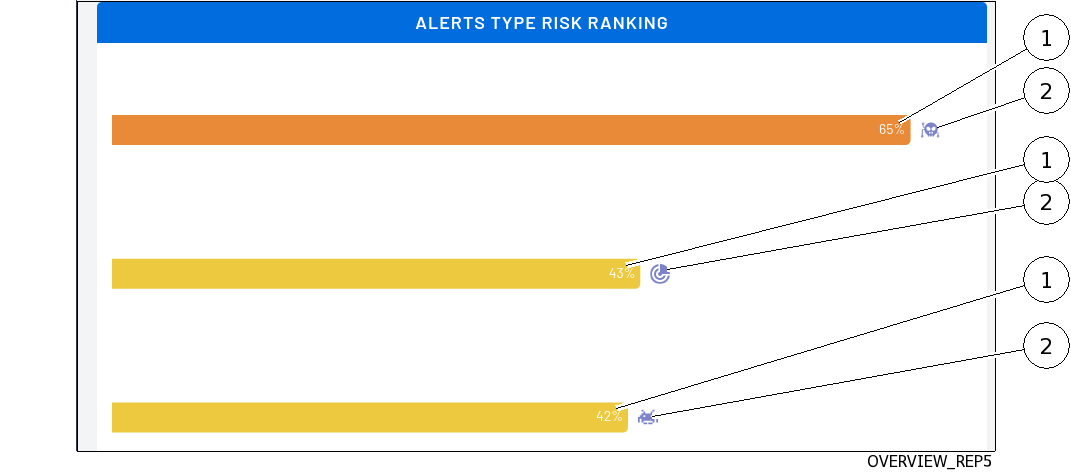
ITEM |
Name |
Description |
|---|---|---|
1 |
Percentage for this type of alert |
Indicates the probability that this likely risk is real |
2 |
Alert type |
Alert type |