7.6. Use of Kibana dashboards
7.6.1. Introduction
For |
go to the |
|---|---|
Investigation method in Kibana |
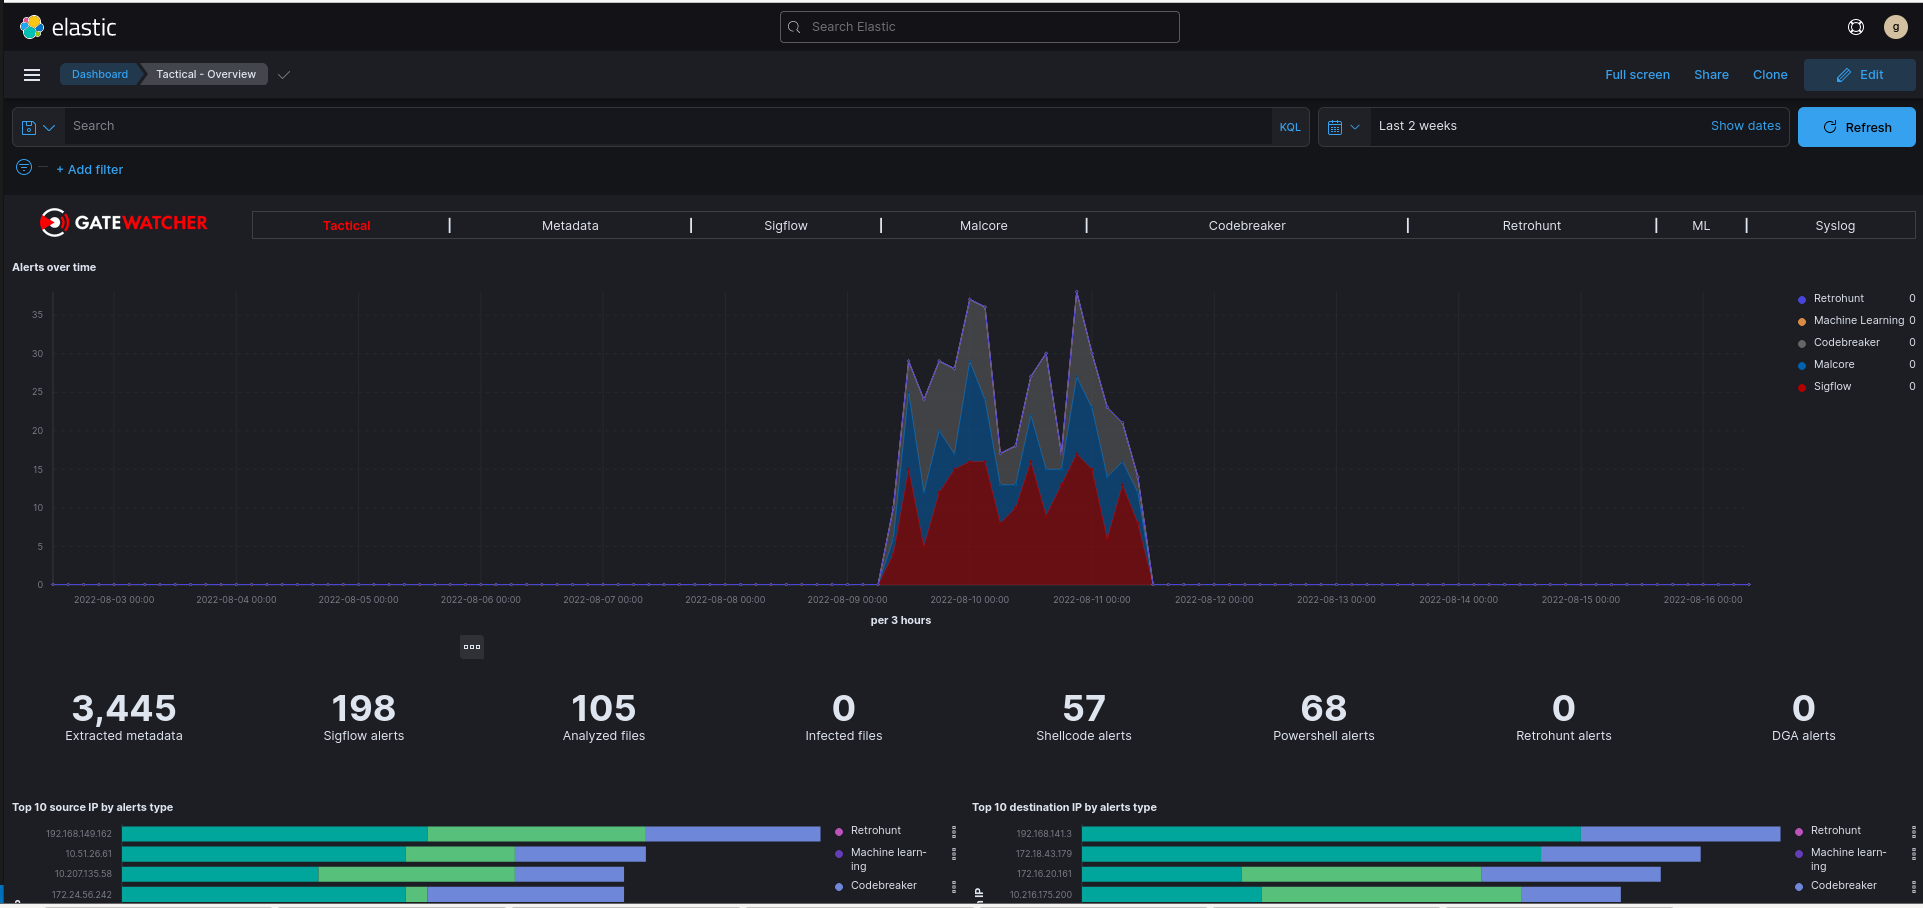
See the Overview of the Kibana GUI.
7.6.2. Prerequisites
User : member of Operator group
7.6.3. Preliminary operations
Login to GCenter via a browser (see Connection to the GCenter web interface via a web browser)
7.6.4. Procedure introducing the Kibana investigation method
From the navigation bar, click on the
`Hunting`button.

Go to the
`Malcore`tab.In the
`Message`tab, locate the alert on an infected file requiring investigation.Scroll down this alert to display all the fields in the event.
Find the
`flow_id`field and perform a positive filter on it by pressing the +. The filter is displayed under the search bar.Click on this filter and then click on
`Pin across all apps`to attach the filter and be able to keep it in the other dashboards.Browse the different "alert" dashboards to see if other alerts were generated for this flow.
Browse the metadata dashboard to see which metadata were generated for this flow.