5.6.25. `Admin-GCenter- Monitor` screen of the legacy web UI
`Monitor` command from the `Admin-GCenter` menu, the following screen is displayed.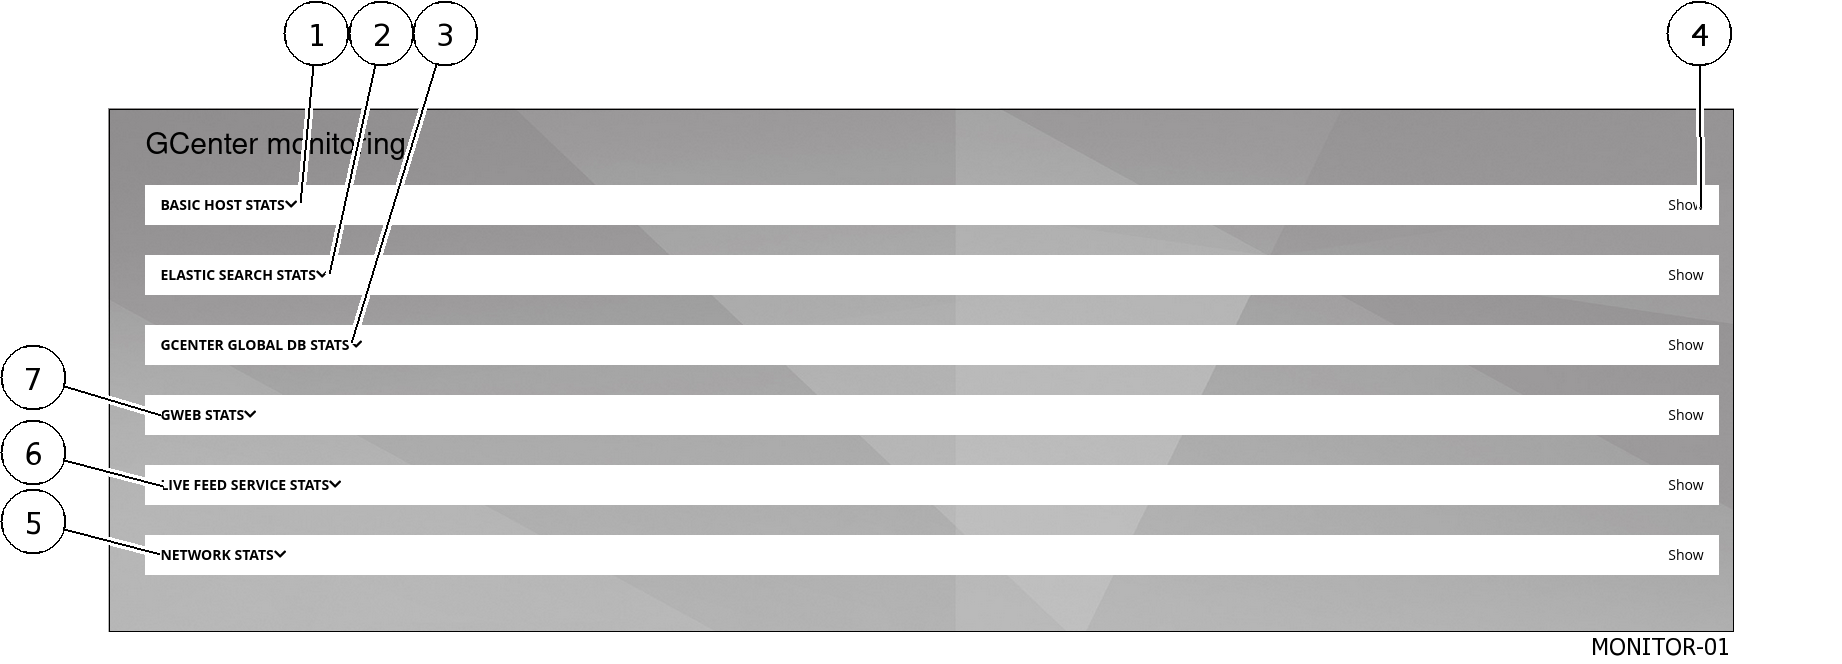
The GATEWATCHER administrator can access information on the monitored services to ensure they are functioning properly:
Item |
Description |
|---|---|
1 |
`Basic host stats` section for real-time information from the GCenter |
2 |
`ELASTIC SEARCH STATS` section for ElasticSearch cluster status information |
3 |
`GCENTER GLOBAL DB STATS` section for global database information |
4 |
Show / Hide button to expand / collapse the hidden area |
5 |
`NETWORK STATS` section for network interface bandwidth information |
6 |
`LIVE FEED SERVICE STATS` section for information on all GCenter services |
7 |
`GWEB STATS` section for information on the Nginx Web server |
5.6.25.2. `Basic host stats` section
The BASIC HOST STATS section provides real-time information from the GCenter with global system indicators such as:
`CPU usage`average`Global Load``RAM Usage``Swap Usage`disk statistics including used, free, and reserved capacity for different directories are also monitored:
`Disk R/W Usage`
`Disk Global Usage`
`Disk Global Usage`
`Disk Usage: /es`
`Disk Usage: /backups`
`Disk Usage: /var/log`
5.6.25.3. `ELASTIC SEARCH STATS` section
`ELASTIC SEARCH STATS` section provides information on the status of the ElasticSearch cluster. This is responsible for recording and then indexing the data captured by the GCap probe in the GCENTER.5.6.25.4. `GCENTER GLOBAL DB STATS` section
This `GCENTER GLOBAL DB STATS` section provides information on what the GCenter's global database is consuming by way of counters:
`Gcenter Global DB Transactions``Gcenter Global DB Reads``Gcenter Global DB Writes``Gcenter Global DB Size`
5.6.25.5. `GWEB STATS` section
This `GWEB STATS` section provides information about the GCenter's Nginx web server with the counters:
`GWeb Active Connections``GWeb Connections Rate Accepted``GWeb Connections Rate Handled``GWeb Requests`
5.6.25.6. `LIVE FEED SERVICE STATS` section
This `LIVE FEED SERVICE STATS` section offers information about all services of the GCenter according to the counters:
`Live Feed Operations``Live Feed Commands``Live Feed Allowed Hits``Live Feed Memory Consumption``Live Feed Memory LUA Consumption``Live Feed Allowed Client Count`
5.6.25.7. `NETWORK STATS` section
This `NETWORK STATS` section provides information about the bandwidth (`Interface Bandwidth for mgmt0`) of the GCenter's mgmt0 network interface.