8.6.2. Export data to a SPLUNK SIEM via the syslog protocol
8.6.2.1. Introduction
On the GCenter, configure data export:
On the Splunk server, install the MT compatible with the GCenter version installed (example TA-gatewatcher-gcenter-v102 for GCenter V102) (see Procedure to be performed on the SPLUNK server)
On the Splunk server, configure the reception of data from the GCenter and associate them to the TA (see Procedure to configure the data receipt)
Note
Note
8.6.2.2. Prerequisites
User : member of Administrator group
8.6.2.3. Preliminary operations
Login to GCenter via a browser (see Connecting to the GCenter web interface via a web browser).
8.6.2.4. Procedure to access to the `Data exports` window for an administrator account
In the navigation bar, click successively on:
The
`Admin`buttonThe
`Gcenter`sub menu`Data exports`commandThe`Data exports`window is displayed.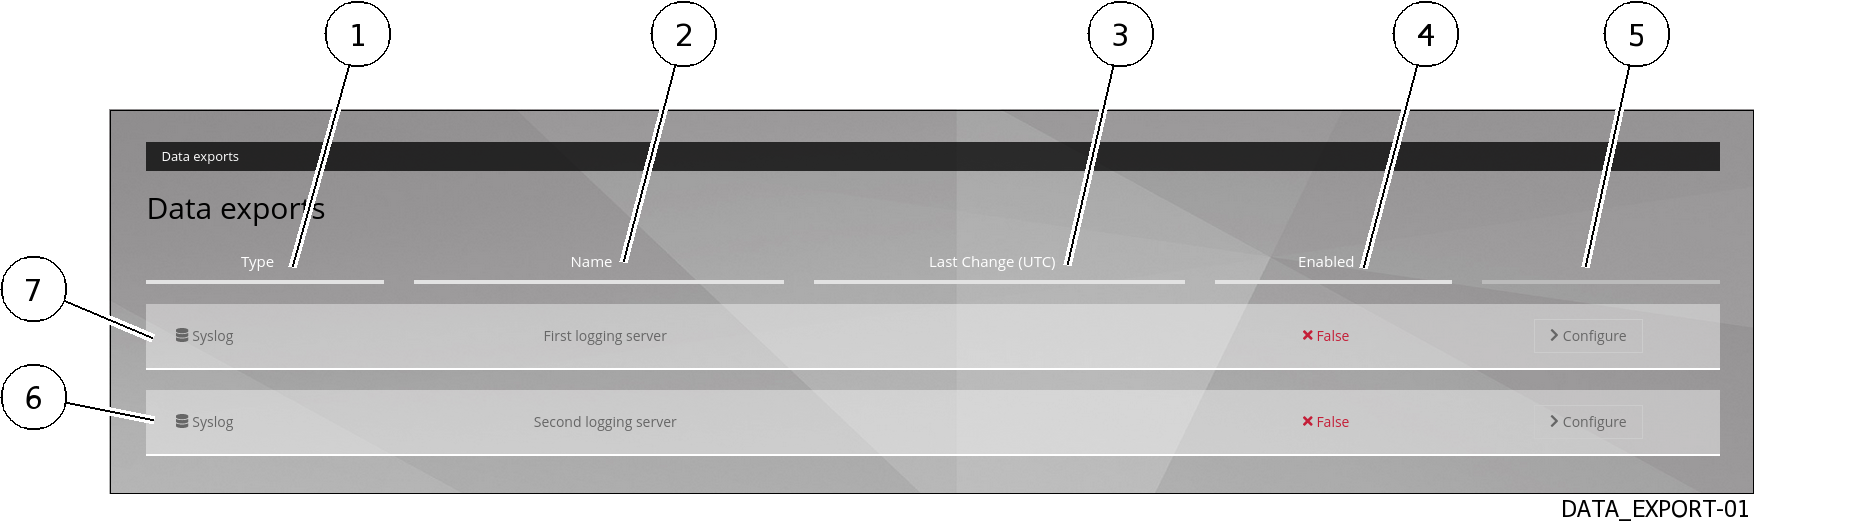
8.6.2.5. Procedure to setup the general settings
- Click the
`Configure`button (5) on one of the two connections (6 or 7) to be configured.The`Syslog data export`window opens.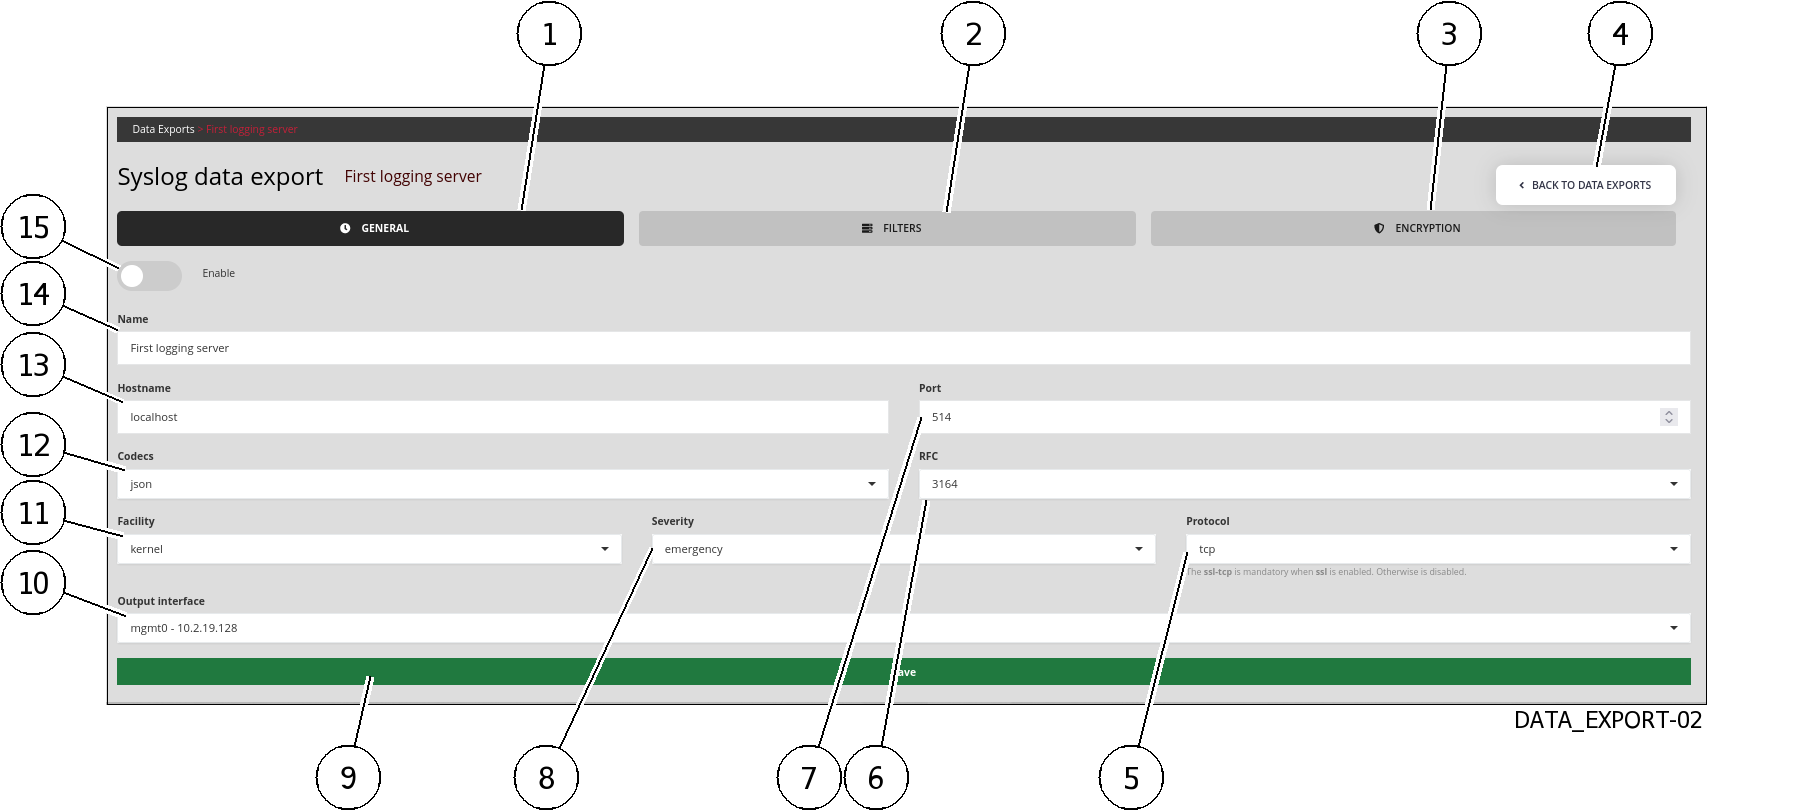
Click on tab (1)
`GENERAL`.
Note
Values with a $VALUE format are context-specific and are noted as such so that they can be referenced in the rest of the documentation.
Enter parameters using the following table:
Item
Parameter
Description
Value
15
Enable
Activate this export pipeline
Activated
14
Name
Syslog export name
$SYSLOG_NAME
13
Hostname
Splunk server DNS name or IP address
$SPLUNK_IP
7
Port
Syslog flow destination port
$SYSLOG_PORT
12
Codecs
Codec used for export
JSON
6
RFC
Standard used by the codec
3164
11
Facility
Syslog header
`facility`default kernel; header will be removed by Splunk TA
8
Severity
Value of
`severity`in Syslog headeremergency by default; the header will be deleted by the Splunk TA
5
Protocol
The transport protocol used. TCP or UDP can be used
$PROTOCOL
10
Output interface
Choose the GCenter interface used for Syslog export
$GCENTER_IFACE
- Validate using button (9)
`Save`.The following message indicates that the update has been completed:`Updated with success`.
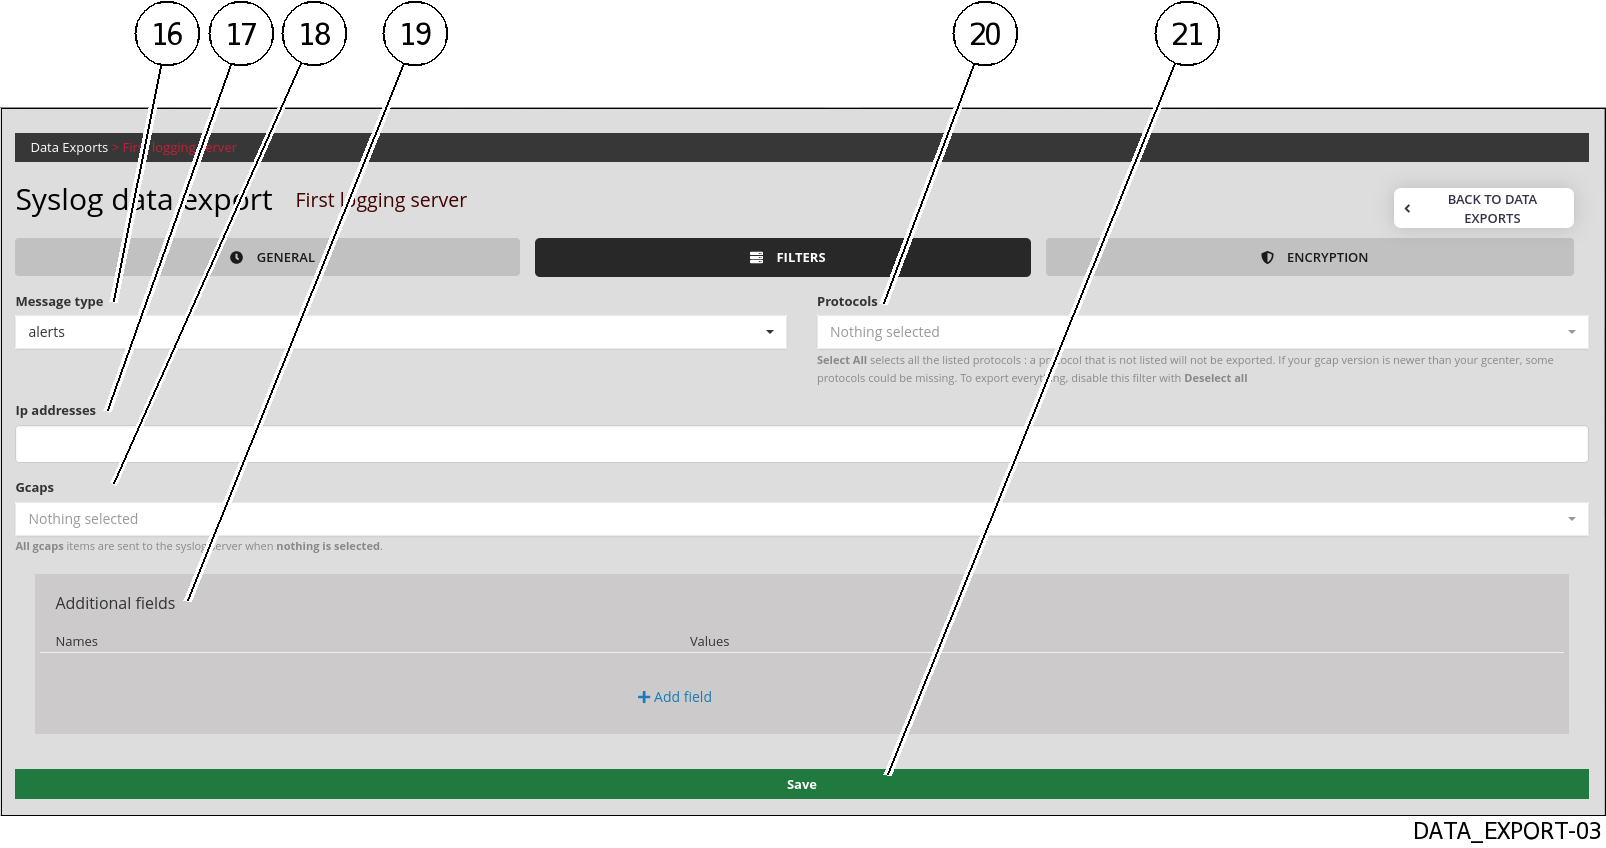
8.6.2.6. Procedure to setup the filtration parameters
Click on the
`FILTERS`tab (2).
Enter parameters using the following table:
Item
Parameter
Description
16
`Message type`Defines the type of event to send to the remote server. Either only alerts or alerts and metadata (Example: alerts, all)
17
`Ip addresses`Filter by IP or networks. By default, all data is sent to the remote server if the field is empty
18
`Gcaps`Filter by GCap. By default, all GCap data paired to GCenter is sent to the remote server if nothing is selected (Example: GCap1, GCap2)
19
`Additional fields``Name`) and a description (`Values`) can be entered in this window.In the case of using the idmef codec, this field is not supported.20
`Protocols`21
`Save`Changes are only taken into account after pressing the
`Save`button.Note
`Select All`selects all the protocols listed: a protocol that is not selected will not be exported.If GCap is newer than GCenter, some protocols may be missing.To export everything, disable this filter with`Deselect all`.
- Validate using button (21)
`Save`.The following message indicates that the update has been completed:`Updated with success`.
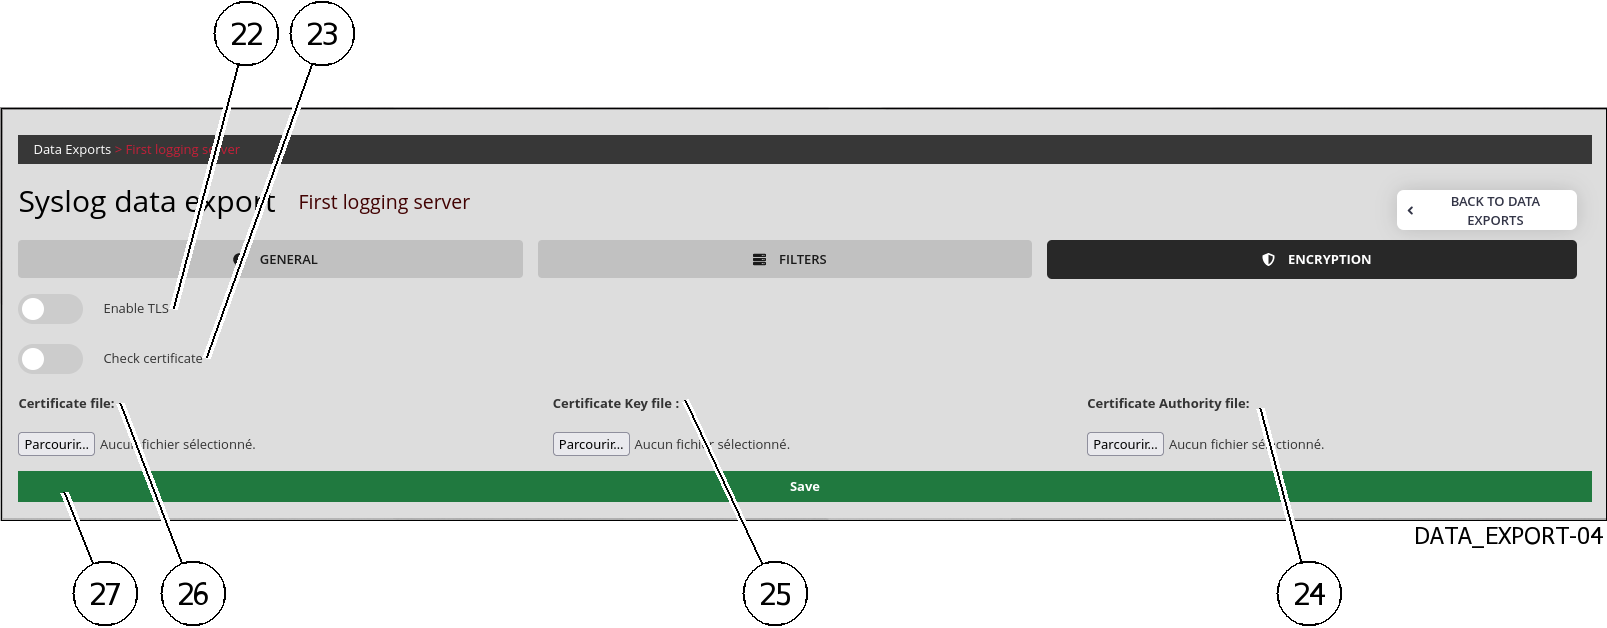
8.6.2.7. Procedure to configure encryption settings
Click on the
`ENCRYPTION`tab (3) .
Enter parameters using the following table:
Item
Parameter
Description
22
`Enable TLS`Enables Transport Layer Security (TLS). Disabled by default
23
`Check certificate`Checks certificate validity when TLS is enabled. Disabled by default.
24
`Certificate file`Add a certificate
25
`Certificate Key file`Adds the associated key
26
`Certificate Authority file`Adds CA file
27
`Save`Changes are only taken into account after pressing the
`Save`button
- Validate using the
`Save`button (27).The following message indicates that the update has been completed:`Updated with success`.
8.6.2.7.1. Procedure to be performed on the SPLUNK server
Contact Gatewatcher support to obtain the TA-gatewatcher-gcenter-v10x.spl file corresponding to the GCenter version.
Note
Splunk TA is still in beta. The content of the TA is detailed at the end of this procedure so that administrators can adapt it to their needs.
The installation of the TA is done as for any Splunk app.The steps are as follows (refer to the documentation for the used version of Splunk for more details):
In the menu:
Manage apps
Install an application from a file
Choose the TA Gatewatcher
Click on the
`Send`button
In the Splunk app management menu, by clicking on "Show objects", you can access all the objects brought by the TA:
Field alias definition
The definition of eventtypes;
Associations between eventtype and tags;
It is possible to enable/disable objects from this interface and modify their permissions (by default, the permissions are at "Global" - Read for everyone - Write for admins only).
8.6.2.7.2. Procedure to configure the data receipt
Parameter
Description
Value
TCP/UDP
Transport protocol used
Must be equal to $PROTOCOL
Port
Listening port on Splunk server
Must be equal to $SYSLOG_PORT
Sourcetype
Sourcetype assigned to the received flow
gw:gcenter:101
App Context
App in which the input.conf file relating to this entry will be placed
TA-gatewatcher-gcenter-101
Index
Index in which the received data will be written
Depending on the data architecture, it is possible to use a specific index for Gatewatcher logs
8.6.2.7.3. Composition of the Technological Add-On (TA)
A Technological Add-On (TA), developed by Gatewatcher, maps the data exported by the GCenter to the Splunk data models.
Note
Note
8.6.2.7.3.1. File props.conf
Note
This example is based on V101.
[gw:gcenter:101]
KV_MODE = json
MAX_TIMESTAMP_LOOKAHEAD = 31
The next section removes the Syslog headers and the @version field of elasticsearch, which is not used.
SEDCMD-gw-1-remove-header = s/^([^\{]+)//
SEDCMD-gw-2-remove-host = s/\"host\":\"[^\s"]+\",?//
SEDCMD-gw-3-remove-version = s/\"@version\":\"[^\s"]+\",?//
SEDCMD-gw-4-remove-trailing_comma = s/,}/}/
TIME_FORMAT = %Y-%m-%dT%H:%M:%S.%6N%Z
TIME_PREFIX = \"timestamp_detected\":\"
The following transformation calls gw_force_host in transforms.conf, and associates the name of the GCenter with the host field used by Splunk.
TRANSFORMS-host = gw_force_host
The following transformation calls the stanzas sourcetype_* of transforms.conf in order to associate a sourcetype according to the engine that generated the log.
TRANSFORMS-override_sourcetype_engine = sourcetype_malcore,sourcetype_codebreaker,sourcetype_sigflow,sourcetype_sigflow_alert
- Logs cannot exceed 65 kb, GCenters are in UTC.
TRUNCATE = 65535
TZ = UTC
category = Splunk App Add-on Builder
pulldown_type = 1
The suite of props.conf allows to associate with each sourcetype field aliases and field evaluations to transform logs to match data models.
[gw:gcenter:101:sigflow:meta]
FIELDALIAS-gw_gcenter_101_sigflow_meta_src = src_ip AS src
FIELDALIAS-gw_gcenter_101_sigflow_meta_dest = dest_ip AS dest
FIELDALIAS-gw_gcenter_101_sigflow_meta_hash = fileinfo.sha256 AS file_hash
FIELDALIAS-gw_gcenter_101_sigflow_meta_alias_1 = tcp.tcp_flags AS tcp_flag
FIELDALIAS-gw_gcenter_101_sigflow_meta_alias_2 = netflow.pkts AS packets
FIELDALIAS-gw_gcenter_101_sigflow_meta_alias_3 = netflow.bytes AS bytes
FIELDALIAS-gw_gcenter_101_sigflow_meta_alias_4 = event_type AS app

FIELDALIAS-gw_gcenter_101_sigflow_meta_http_alias_02 = http.status AS status
FIELDALIAS-gw_gcenter_101_sigflow_meta_http_alias_03 = http.length AS bytes
FIELDALIAS-gw_gcenter_101_sigflow_meta_http_alias_04 = http.url AS uri_query
FIELDALIAS-gw_gcenter_101_sigflow_meta_http_alias_05 = http.hostname AS url_domain
FIELDALIAS-gw_gcenter_101_sigflow_meta_http_alias_06 = http.http_content_type AS http_content_type
FIELDALIAS-gw_gcenter_101_sigflow_meta_http_alias_07 = http.http_method AS http_method
FIELDALIAS-gw_gcenter_101_sigflow_meta_http_alias_08 = http.http_user_agent AS http_user_agent
FIELDALIAS-gw_gcenter_101_sigflow_meta_http_alias_09 = http.http_refer AS http_referrer

EVAL-action = "allowed"
EVAL-protocol = "ip"
EVAL-transport = lower(proto)
EVAL-url = url_domain+uri_query

[gw:gcenter:101:sigflow:alert]
EVAL-action = "allowed"
EVAL-transport = low(proto)
FIELDALIAS-gw_gcenter_101_sigflow_alert_alias_1 = src_ip AS src
FIELDALIAS-gw_gcenter_101_sigflow_alert_alias_2 = dest_ip AS dest
FIELDALIAS-gw_gcenter_101_sigflow_alert_alias_3 = alert.signature AS signature
FIELDALIAS-gw_gcenter_101_sigflow_alert_alias_4 = alert.signature_id AS signature_id
FIELDALIAS-gw_gcenter_101_sigflow_alert_alias_5 = severity AS severity_id

[gw:gcenter:101:malcore]
FIELDALIAS-gw_gcenter_101_malcore_src = src_ip AS src
FIELDALIAS-gw_gcenter_101_malcore_dest = dest_ip AS dest
FIELDALIAS-gw_gcenter_101_malcore_hash = SHA256 AS file_hash
FIELDALIAS-gw_gcenter_101_malcore_alias_2 = src_ip AS src
FIELDALIAS-gw_gcenter_101_malcore_alias_3 = dest_ip AS dest
FIELDALIAS-gw_gcenter_101_malcore_alias_4 = filename AS file_name
FIELDALIAS-gw_gcenter_101_malcore_alias_5 = http_uri AS file_path
FIELDALIAS-gw_gcenter_101_malcore_alias_6 = total_found AS signature_id

[gw:gcenter:101:codebreaker]
FIELDALIAS-gw_gcenter_101_codebreaker_src = src_ip AS src
FIELDALIAS-gw_gcenter_101_codebreaker_dest = dest_ip AS dest
FIELDALIAS-gw_gcenter_101_codebreaker_hash = SHA256 AS file_hash
FIELDALIAS-gw_gcenter_101_codebreaker_alias_4 = event_type AS category
8.6.2.7.3.2. File transforms.conf
Note
This example is based on V101.
The stanzas in this file are used by props.conf, and refer to fields indexed by Splunk, such as host or sourcetype.
[gw_force_host]
LOOKAHEAD = 65535
DEST_KEY = MetaData:Host
REGEX = \"GCenter\"\:\"([^\"]+)
FORMAT = host::$1

[sourcetype_malcore]
LOOKAHEAD = 65535
REGEX = \"type\"\:\"malcore\"
FORMAT = sourcetype::gw:gcenter:101:malcore
DEST_KEY = MetaData:Sourcetype

[sourcetype_codebreaker]
LOOKAHEAD = 65535
REGEX = \"type\"\:\"codebreaker\"
FORMAT = sourcetype::gw:gcenter:101:codebreaker
DEST_KEY = MetaData:Sourcetype

[sourcetype_sigflow]
LOOKAHEAD = 65535
REGEX = \"type\"\:\"suricata\"
FORMAT = sourcetype::gw:gcenter:101:sigflow:meta
DEST_KEY = MetaData:Sourcetype

[sourcetype_sigflow_alert]
LOOKAHEAD = 65535
REGEX = \"event_type\"\:\"alert\"
FORMAT = sourcetype::gw:gcenter:101:sigflow:alert
DEST_KEY = MetaData:Sourcetype
8.6.2.7.3.3. File eventtype.conf
Note
This example is based on V101.
[malcore_clean]
search = (sourcetype=gw:gcenter:101:malcore event_type=malware retroact="None" code=0 )
description = An event that occurs when malcore analyses a file and none of the engines detects a threat

[malcore_infected]
search = (sourcetype=gw:gcenter:101:malcore event_type=malware retroact="None" code=1)
description = An event that occurs when malcore analyses a file and at least one of the engines detects a threat
color = et_red

[malcore_suspicious]
search = (sourcetype=gw:gcenter:101:malcore event_type=malware retroact="None" code=2)
description = An event that occurs when malcore analyses a file, none of the engines detects a threat but at least one classifies the file as suspicious. Suspicious files can be analysed lated by retroact, if enabled.
color = et_orange

[malcore_other]
search = (sourcetype=gw:gcenter:101:malcore event_type=malware retroact="None" NOT code IN (0,1,2))
description = An event that occurs when malcore returns a code indicating an exception or a failure in the analysis.
color = et_blue
Events related to the anti-viral re-analysis of "suspicious" files (retroact):
[retroact_clean]
search = (sourcetype=gw:gcenter:101:malcore event_type=malware retroact!="None" code=0 )
description = An event that occurs when retroact analyses a file and none of the engines detects a threat
color = et_blue

[retroact_infected]
search = (sourcetype=gw:gcenter:101:malcore event_type=malware retroact!="None" code=2)
description = An event that occurs when retroact analyses a file and at least one of the engines detects a threat
color = et_red

[retroact_suspicious]
search = (sourcetype=gw:gcenter:101:malcore event_type=malware retroact!="None" code=2)
description = An event that occurs when retroact analyses a file, none of the engines detects a threat but at least one classifies the file as suspicious. Suspicious files can be analysed lated by retroact, if enabled.
color = et_orange

[retroact_other]
search = (sourcetype=gw:gcenter:101:malcore event_type=malware retroact!="None" NOT code IN (0,1,2))
description = An event that occurs when retroact returns a code indicating an exception or a failure in the analysis.
color = et_blue
Event on enabling netflow logging on GCap:
[sigflow_netflow]
search = (sourcetype=gw:gcenter:101:sigflow:meta event_type=netflow)
description = An event that occurs when sigflow generates a netflow event from a network event.
GCap File Reconstruction Events:
[sigflow_fileinfo_stored]
search = (sourcetype=gw:gcenter:101:sigflow:meta event_type=fileinfo fileinfo.stored="true")
description = An event that occurs when sigflow has performed a file reconstruction and based on its ruleset, has stored it on disk to perform malcore analysis afterwards.
color = et_blue

[sigflow_fileinfo_not_stored]
search = (sourcetype=gw:gcenter:101:sigflow:meta event_type=fileinfo fileinfo.stored="false")
description = An event that occurs when sigflow has performed a file reconstruction and based on its ruleset, has not stored it on disk.
Sigflow engine events can be of two types for each protocol:
"meta" event: generation of metadata, obtained by enabling protocol logging on GCap.
"Alert" event: generation of an alert, obtained by enabling protocol parsing on the GCap, and the correspondence between a flow and a sigflow rule.
[sigflow_meta_dcerpc]
search = (sourcetype=gw:gcenter:101:sigflow:meta event_type=dcerpc)
description = An event that occurs when sigflow has reconstructed a dcerpc flow and has logged its metadata.

[sigflow_alert_dcerpc]
search = (sourcetype=gw:gcenter:101:sigflow:alert event_type=alert app_proto=dcerpc)
description = An event that occurs when sigflow has reconstructed a dcerpc flow and that one of its rules matched the content of this flow.
color = et_red

[sigflow_meta_dhcp]
search = (sourcetype=gw:gcenter:101:sigflow:meta event_type=dhcp)
description = An event that occurs when sigflow has reconstructed a dhcp flow and has logged its metadata.

[sigflow_alert_dhcp]
search = (sourcetype=gw:gcenter:101:sigflow:alert event_type=alert app_proto=dhcp)
description = An event that occurs when sigflow has reconstructed a dhcp flow and that one of its rules matched the content of this flow.
color = et_red

[sigflow_meta_dnp3]
search = (sourcetype=gw:gcenter:101:sigflow:meta event_type=dnp3)
description = An event that occurs when sigflow has reconstructed a dnp3 flow and has logged its metadata.

[sigflow_alert_dnp3]
search = (sourcetype=gw:gcenter:101:sigflow:alert event_type=alert app_proto=dnp3)
description = An event that occurs when sigflow has reconstructed a dnp3 flow and that one of its rules matched the content of this flow.
color = et_red

[sigflow_meta_dns]
search = (sourcetype=gw:gcenter:101:sigflow:meta event_type=dns)
description = An event that occurs when sigflow has reconstructed a dns flow and has logged its metadata.
priority = 2

[sigflow_alert_dns]
search = (sourcetype=gw:gcenter:101:sigflow:alert event_type=alert app_proto=dns)
description = An event that occurs when sigflow has reconstructed a dns flow and that one of its rules matched the content of this flow.
color = et_red

[sigflow_meta_ftp]
search = (sourcetype=gw:gcenter:101:sigflow:meta event_type=ftp)
description = An event that occurs when sigflow has reconstructed a ftp flow and has logged its metadata.

[sigflow_alert_ftp]
search = (sourcetype=gw:gcenter:101:sigflow:alert event_type=alert app_proto=ftp)
description = An event that occurs when sigflow has reconstructed a ftp flow and that one of its rules matched the content of this flow.
color = et_red

[sigflow_meta_http]
search = (sourcetype=gw:gcenter:101:sigflow:meta event_type=http)
description = An event that occurs when sigflow has reconstructed a http flow and has logged its metadata.

[sigflow_alert_http]
search = (sourcetype=gw:gcenter:101:sigflow:alert event_type=alert app_proto=http)
description = An event that occurs when sigflow has reconstructed a http flow and that one of its rules matched the content of this flow.
color = et_red

[sigflow_meta_ikev2]
search = (sourcetype=gw:gcenter:101:sigflow:meta event_type=ikev2)
description = An event that occurs when sigflow has reconstructed a ikev2 flow and has logged its metadata.

[sigflow_alert_ikev2]
search = (sourcetype=gw:gcenter:101:sigflow:alert event_type=alert app_proto=ikev2)
description = An event that occurs when sigflow has reconstructed a ikev2 flow and that one of its rules matched the content of this flow.
color = et_red

[sigflow_meta_krb5]
search = (sourcetype=gw:gcenter:101:sigflow:meta event_type=krb5)
description = An event that occurs when sigflow has reconstructed a krb5 flow and has logged its metadata.

[sigflow_alert_krb5]
search = (sourcetype=gw:gcenter:101:sigflow:alert event_type=alert app_proto=krb5)
description = An event that occurs when sigflow has reconstructed a krb5 flow and that one of its rules matched the content of this flow.
color = et_red

[sigflow_meta_modbus]
search = (sourcetype=gw:gcenter:101:sigflow:meta event_type=modbus)
description = An event that occurs when sigflow has reconstructed a modbus flow and has logged its metadata.

[sigflow_alert_modbus_alert]
search = (sourcetype=gw:gcenter:101:sigflow:alert event_type=alert app_proto=modbus)
description = An event that occurs when sigflow has reconstructed a modbus flow and that one of its rules matched the content of this flow.
color = et_red

[sigflow_meta_nfs]
search = (sourcetype=gw:gcenter:101:sigflow:meta event_type=nfs)
description = An event that occurs when sigflow has reconstructed a nfs flow and has logged its metadata.

[sigflow_alert_nfs]
search = (sourcetype=gw:gcenter:101:sigflow:alert event_type=alert app_proto=nfs)
description = An event that occurs when sigflow has reconstructed a nfs flow and that one of its rules matched the content of this flow.
color = et_red

[sigflow_meta_ntp]
search = (sourcetype=gw:gcenter:101:sigflow:meta event_type=ntp)
description = An event that occurs when sigflow has reconstructed a ntp flow and has logged its metadata.

[sigflow_alert_ntp]
search = (sourcetype=gw:gcenter:101:sigflow:alert event_type=alert app_proto=ntp)
description = An event that occurs when sigflow has reconstructed a ntp flow and that one of its rules matched the content of this flow.
color = et_red

[sigflow_meta_smb]
search = (sourcetype=gw:gcenter:101:sigflow:meta event_type=smb)
description = An event that occurs when sigflow has reconstructed a smb flow and has logged its metadata.

[sigflow_alert_smb]
search = (sourcetype=gw:gcenter:101:sigflow:alert event_type=alert app_proto=smb)
description = An event that occurs when sigflow has reconstructed a smb flow and that one of its rules matched the content of this flow.
color = et_red

[sigflow_meta_smtp]
search = (sourcetype=gw:gcenter:101:sigflow:meta event_type=smtp)
description = An event that occurs when sigflow has reconstructed a smtp flow and has logged its metadata.

[sigflow_alert_smtp]
search = (sourcetype=gw:gcenter:101:sigflow:alert event_type=alert app_proto=smtp)
description = An event that occurs when sigflow has reconstructed a smtp flow and that one of its rules matched the content of this flow.
color = et_red

[sigflow_meta_ssh]
search = (sourcetype=gw:gcenter:101:sigflow:meta event_type=ssh)
description = An event that occurs when sigflow has reconstructed a ssh flow and has logged its metadata.

[sigflow_alert_ssh]
search = (sourcetype=gw:gcenter:101:sigflow:alert event_type=alert app_proto=ssh)
description = An event that occurs when sigflow has reconstructed a ssh flow and that one of its rules matched the content of this flow.
color = et_red

[sigflow_meta_tftp]
search = (sourcetype=gw:gcenter:101:sigflow:meta event_type=tftp)
description = An event that occurs when sigflow has reconstructed a tftp flow and has logged its metadata.

[sigflow_alert_tftp]
search = (sourcetype=gw:gcenter:101:sigflow:alert event_type=alert app_proto=tftp)
description = An event that occurs when sigflow has reconstructed a tftp flow and that one of its rules matched the content of this flow.
color = et_red

[sigflow_meta_tls]
search = (sourcetype=gw:gcenter:101:sigflow:meta event_type=tls)
description = An event that occurs when sigflow has reconstructed a tls flow and has logged its metadata.

[sigflow_alert_tls]
search = (sourcetype=gw:gcenter:101:sigflow:alert event_type=alert app_proto=tls)
description = An event that occurs when sigflow has reconstructed a tls flow and that one of its rules matched the content of this flow.
color = et_red

[sigflow_unknown_alert]
search = (sourcetype=gw:gcenter:101:sigflow* event_type=alert (app_proto=failed OR NOT app_proto=*))
description = An event that occurs when sigflow has reconstructed the flow of an unknown protocol, and that one of its rules matched the content of this flow.
color = et_red

[sigflow_other]
search = (sourcetype=gw:gcenter:101:sigflow* type=suricata NOT event_type IN (netflow,fileinfo,alert,dcerpc,dhcp,dnp3,dns,ftp,http,ikev2,krb5,modbus,nfs,ntp,smb,smtp,ssh,tftp,tls))
description = An event that occurs when sigflow has reconstructed the flow of a protocol not expected by this add-on.
color = et_blue
DGA DETECT Machine Learning Engine Events:
[dgadetect_clean]
search = (sourcetype=gw:gcenter:101:sigflow:meta dga_probability=* severity=0)
description = An event that occurs when dgadetect find that a domain name is not suspicious (likeky not generated by a Domain Generation Algorithm). This eventtype overlap the sigflow:dns:meta eventtype.

[dgadetect_suspicious]
search = (sourcetype=gw:gcenter:101:sigflow:meta dga_probability=* severity=1)
description = An event that occurs when dgadetect find that a domain name is suspicious (likeky generated by a Domain Generation Algorithm).
color = et_red
Codebreaker Engine Events:
[codebreaker_shellcode_expoit]
search = (sourcetype=gw:gcenter:101:codebreaker type=codebreaker event_type=shellcode state=Exploit)
description = An event that occurs when codebreaker has detected a shellcode.
color = et_red

[codebreaker_shellcode_suspicious]
search = (sourcetype=gw:gcenter:101:codebreaker type=codebreaker event_type=shellcode state=Suspicious)
description = An event that occurs when codebreaker suspects it has potentially detected a shellcode.
color = et_orange

[codebreaker_shellcode_other]
search = (sourcetype=gw:gcenter:101:codebreaker type=codebreaker event_type=shellcode NOT state IN ('Suspicious','Exploit'))
description = An event that occurs when codebreaker returns a code indicating an exception or a failure in its shellcode analysis.
color = et_blue

[codebreaker_powershell_expoit]
search = (sourcetype=gw:gcenter:101:codebreaker type=codebreaker event_type=powershell state=Exploit)
description = An event that occurs when codebreaker has detected an exploit in a powershell.
color = et_red

[codebreaker_powershell_suspicious]
search = (sourcetype=gw:gcenter:101:codebreaker type=codebreaker event_type=powershell state=Suspicious)
description = An event that occurs when codebreaker suspects it has potentially detected a suspicious powershell.
color = et_orange

[codebreaker_powershell_other]
search = (sourcetype=gw:gcenter:101:codebreaker type=codebreaker event_type=powershell NOT state IN ('Suspicious','Exploit'))
description = An event that occurs when codebreaker returns a code indicating an exception or a failure in its powershell analysis.
color = et_blue