8.2.1. Quick procedure for analysing a file
8.2.1.1. Introduction
`Quick analysis` screen enables an operator to:submit one or more files via the GBox Web interface for analysis
- view the analysis reportThis analysis is performed by the engine(s) defined and configured in the default template.The analysis is always performed using the default template.It is not possible to test files that have a password. For this, use the
`New Analysis`screen (voir Procedure for analysing a file in the `New analysis` screen).Note
Templates are managed by the administrator.
Note
Please note that the maximum file size must not exceed 50MB by default.There is no limit to the number of file scans.
The graphical interface is described in `Home` screen of the Web UI.
8.2.1.1.1. Supported file types
.jpg
.bmp
.mp3
.avi
.java
.js
.sql
.html
.css
.class
.c
.bat
.txt
.csv
.rules
.xls
.png
.key
.pem
.wav
.azw3
.mp4
.exe
.pcap
.xlsx
.docx
.pptx
.odt (managed as an archive)
.tar
8.2.1.1.2. Unsupported file types
Bourne-Again
POSIX shell script
ELF
Python
8.2.1.1.3. Compressed files
Regarding compressed files analysed by the Malcore engine:
The number of files contained in an archive is limited and can be modified. 50 is the default value.
The number of times the file is compressed is limited (max recursion level) and is modifiable. 5 is the default
If the files are protected by a password, this must be declared in the global
Settings are only accessible to members of the administrator group.
8.2.1.2. Prerequisites
User: member of Operators Group
8.2.1.3. Preliminary operations
Connect to the GBox via a browser (see Connection to the web interface via a browser).
8.2.1.4. Procedure for analysing a file
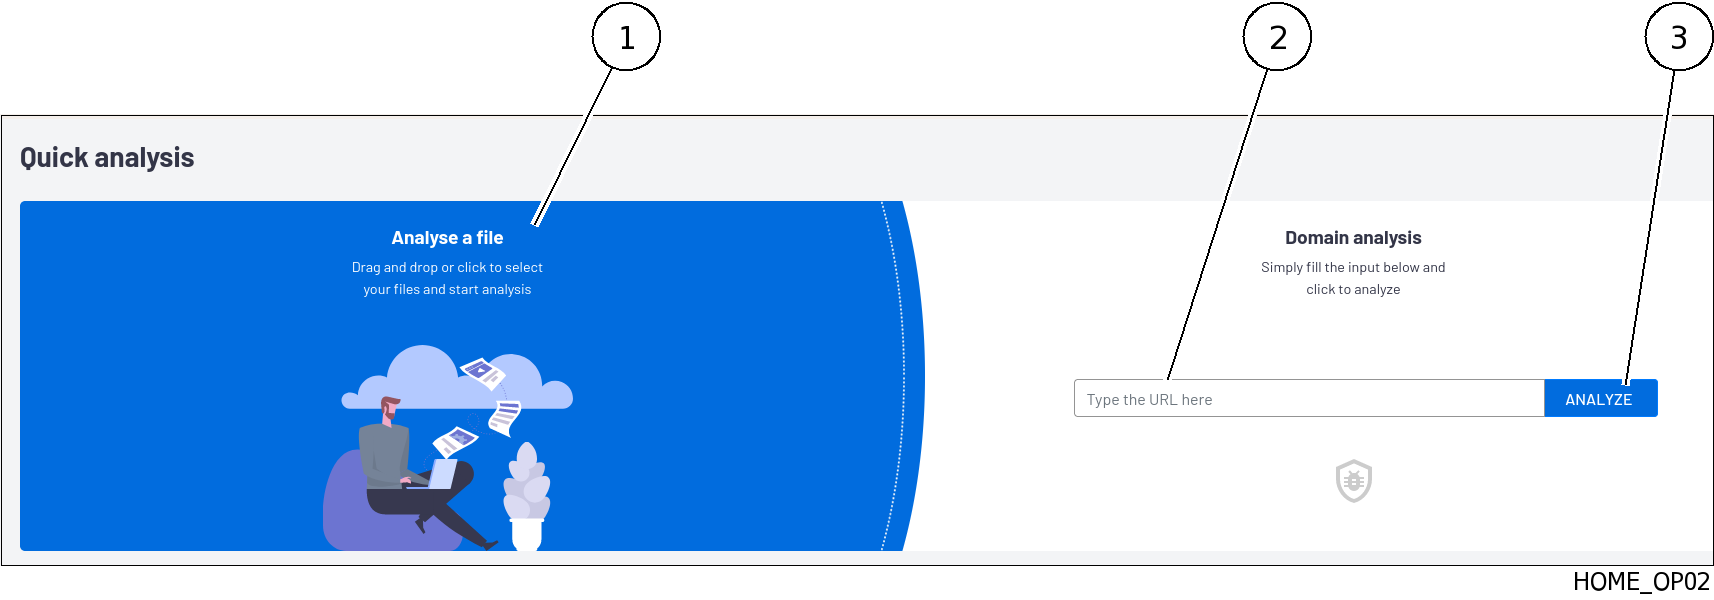
- Drop the desired file in the
`Analyse a file`area.Or - Click on this area to send the suspicious file.The analysis is automatically initiated and the result is automatically displayed in a report in the
`Analysis history`area.
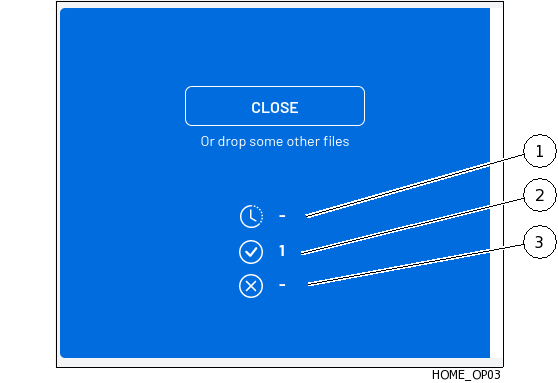
8.2.1.5. Procedure for analysing download information
The loading report is displayed in the following window:
Marker |
Name |
|---|---|
1 |
Icon showing the loading time |
2 |
Total number of files downloaded |
3 |
Download error |
Analyse the value of fields (1) to (3) with the following information:
Icon (2) shows the total number of files downloaded while the current page is active.
The value of icon (3) is:
0: no error detected during the download
1 or more: at least one error occurred
8.2.1.6. Procedure for analysing the report
Each file scanned generates a report that is displayed in the `Analysis history` area.
Note
- Analysing reports.For this, please refer to the Procedure to analyse the contents of a report.