5.2.2. `Home` screen of the Web UI
`HOME` or `GATEWATCHER` buttons on the navigation bar, the `Home` screen is displayed.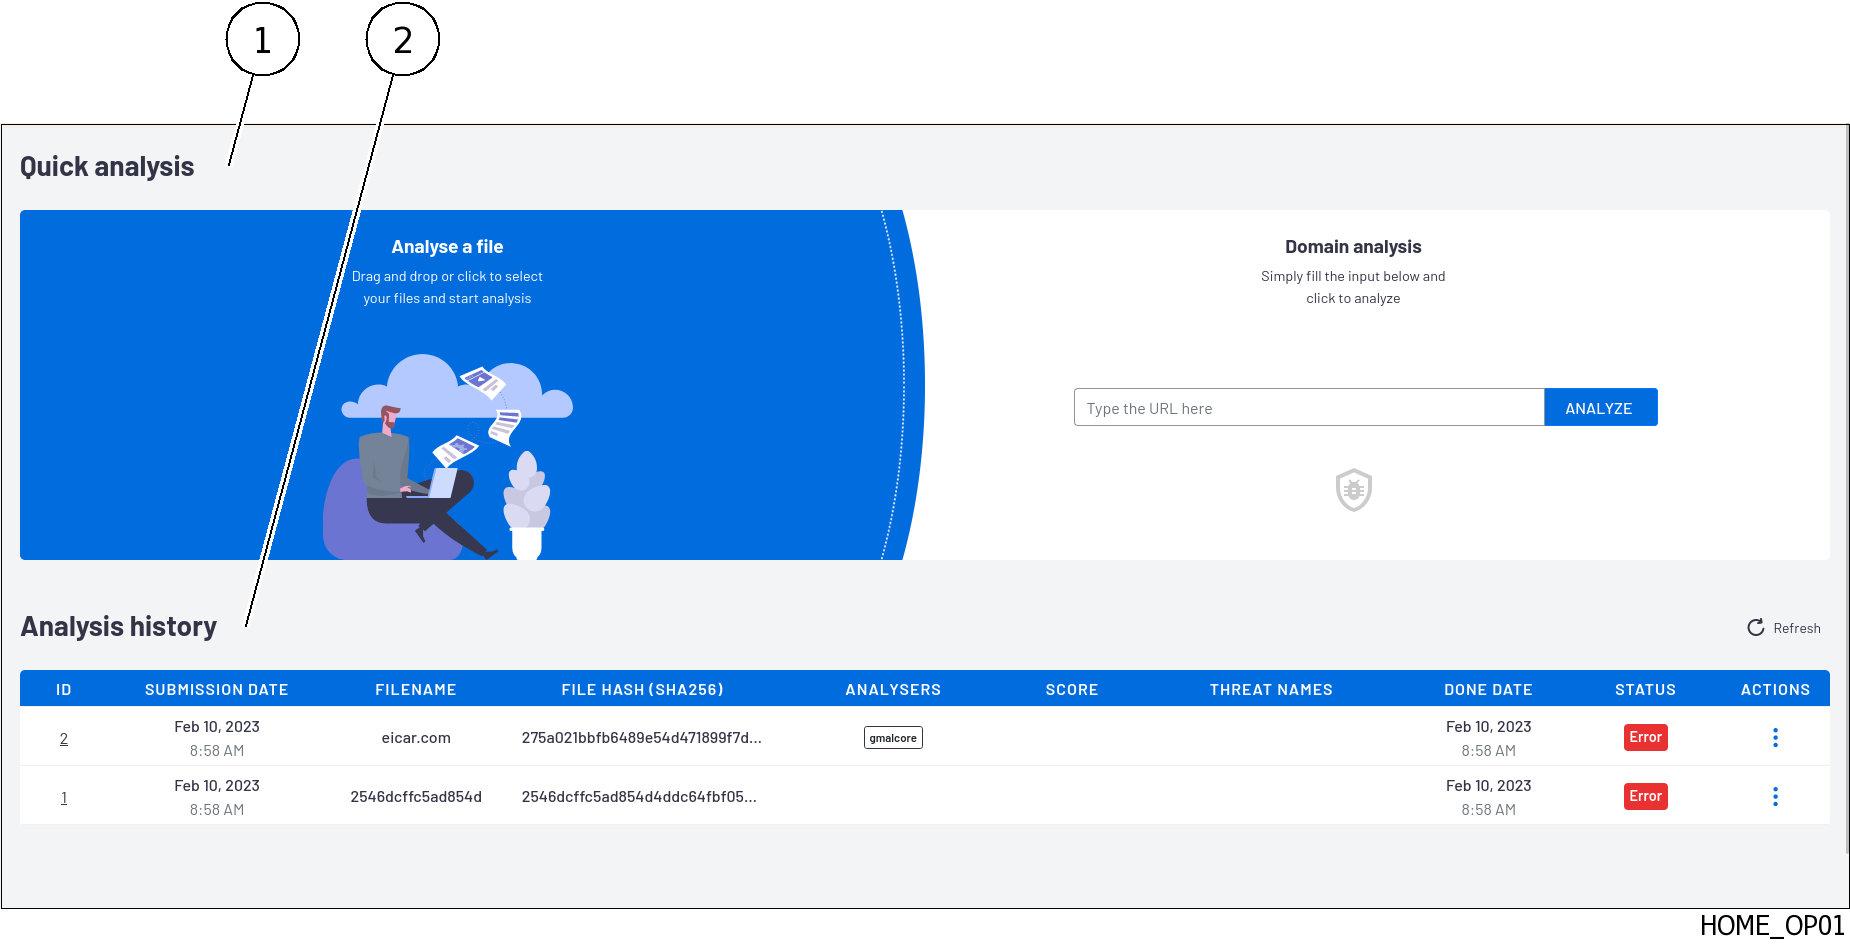
Marker |
Name |
|---|---|
1 |
|
2 |
5.2.2.1. `Quick analysis` zone
This area enables users to quickly:
- Or upload one or more files from the user's computer to the GBox using the
`Analysis a file`zone and run an analysis, the results of which are shown in a report.This analysis will be carried out using the default model defined by an Administrator group member.If the files are compressed and have a password, then you need to use the `New analysis` screen of the Web UI. Or analyse a domain using the
`Domain analysis`zone.
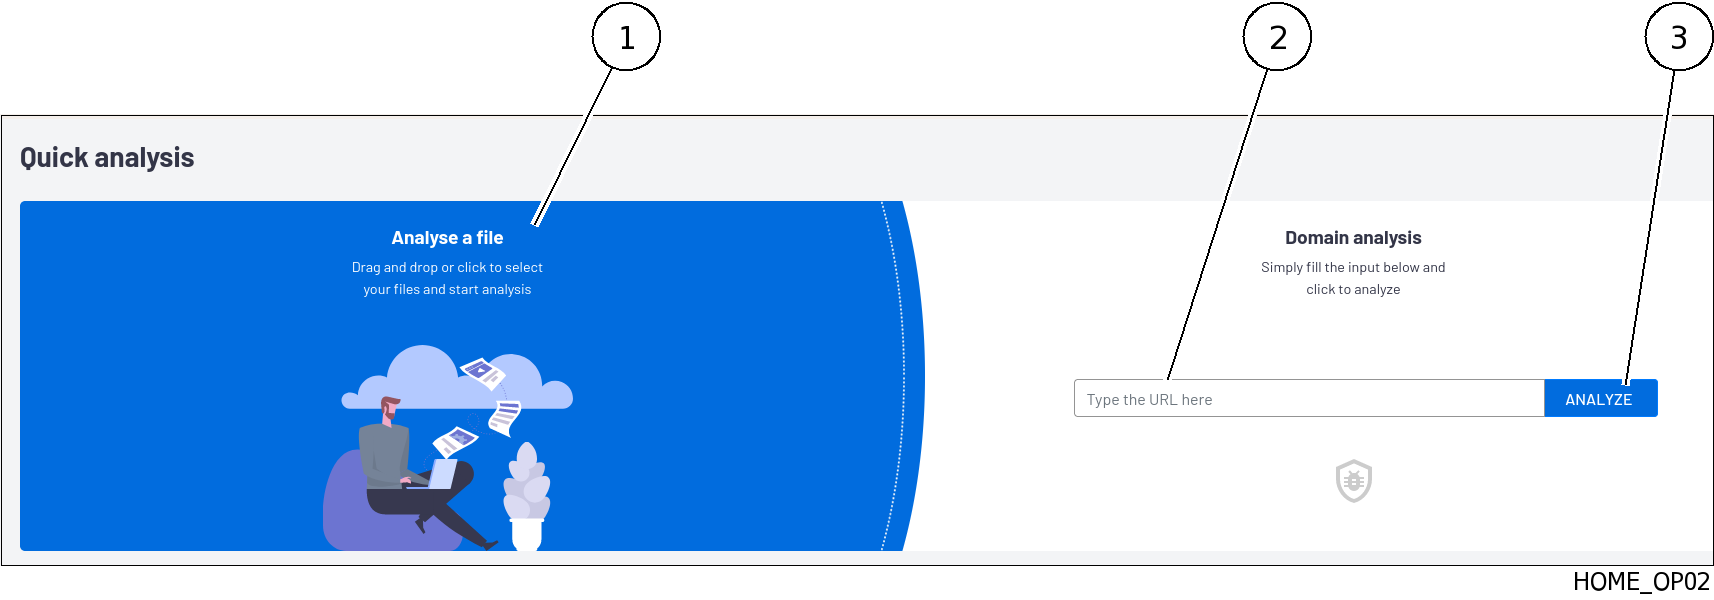
Marker |
Name |
|---|---|
1 |
Area for dropping a file for analysis |
2 |
Entry field for the URL of the domain to be analysed |
3 |
Run domain analysis button |
5.2.2.2. `Analysis history` zone
This zone enables viewing the history of the analyses performed.
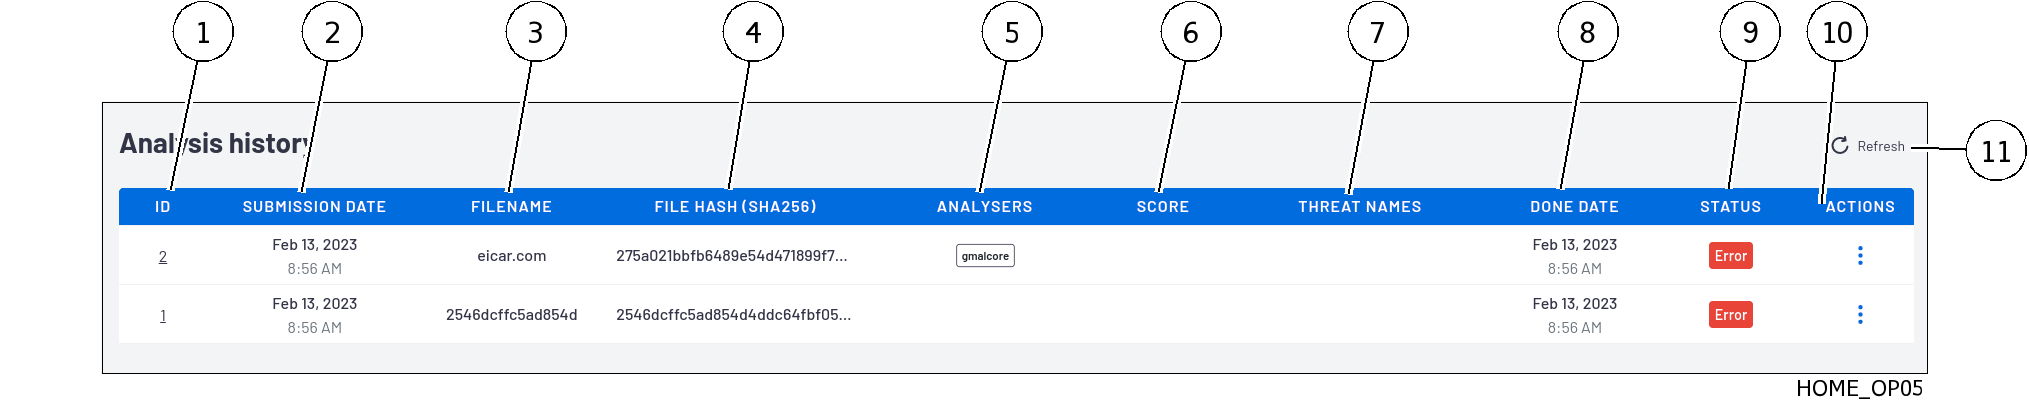
Analyses are sorted according to:
Date in the
`DONE DATE`fieldIf there is no information in this field
From the
`STATUS`field: first the`New`status, then the`In progress`status, then the`Done'', or ```Error`status.
Each line represents a separate analysis. The information for each analysis is presented and detailed in the table below.
Marker |
Name |
Description |
|---|---|---|
1 |
|
Analysis number.
The listed reports are sorted from the most recent to the earliest.
Clicking on this field opens the
`Analysis report` page for this report |
2 |
|
Time and date of the analysis submission |
3 |
|
Name of the analysed file
Clicking on this field copies the name to the clipboard
|
4 |
|
SHA256 of the file
Clicking on this field copies the hash to the clipboard
|
5 |
|
Indicates the name of the engines used for the analysis |
6 |
|
Global threat analysis score calculated from the analysis score reported by the various engines |
7 |
|
Name of the threat reported by the gmalcore module (or n/a)
| Clicking on this field copies the hash to the clipboard
|
8 |
|
End date and time of the analysis |
9 |
|
Overall status of the analysis, either Done, In Progress, In queue, or Error
In the event of an error, further information is available in the analysis report
|
10 |
|
Possible actions: download the report in pdf format |