5.2.4. `Reports` screen of the Web UI
5.2.4.1. Overview of the `Reports` screen
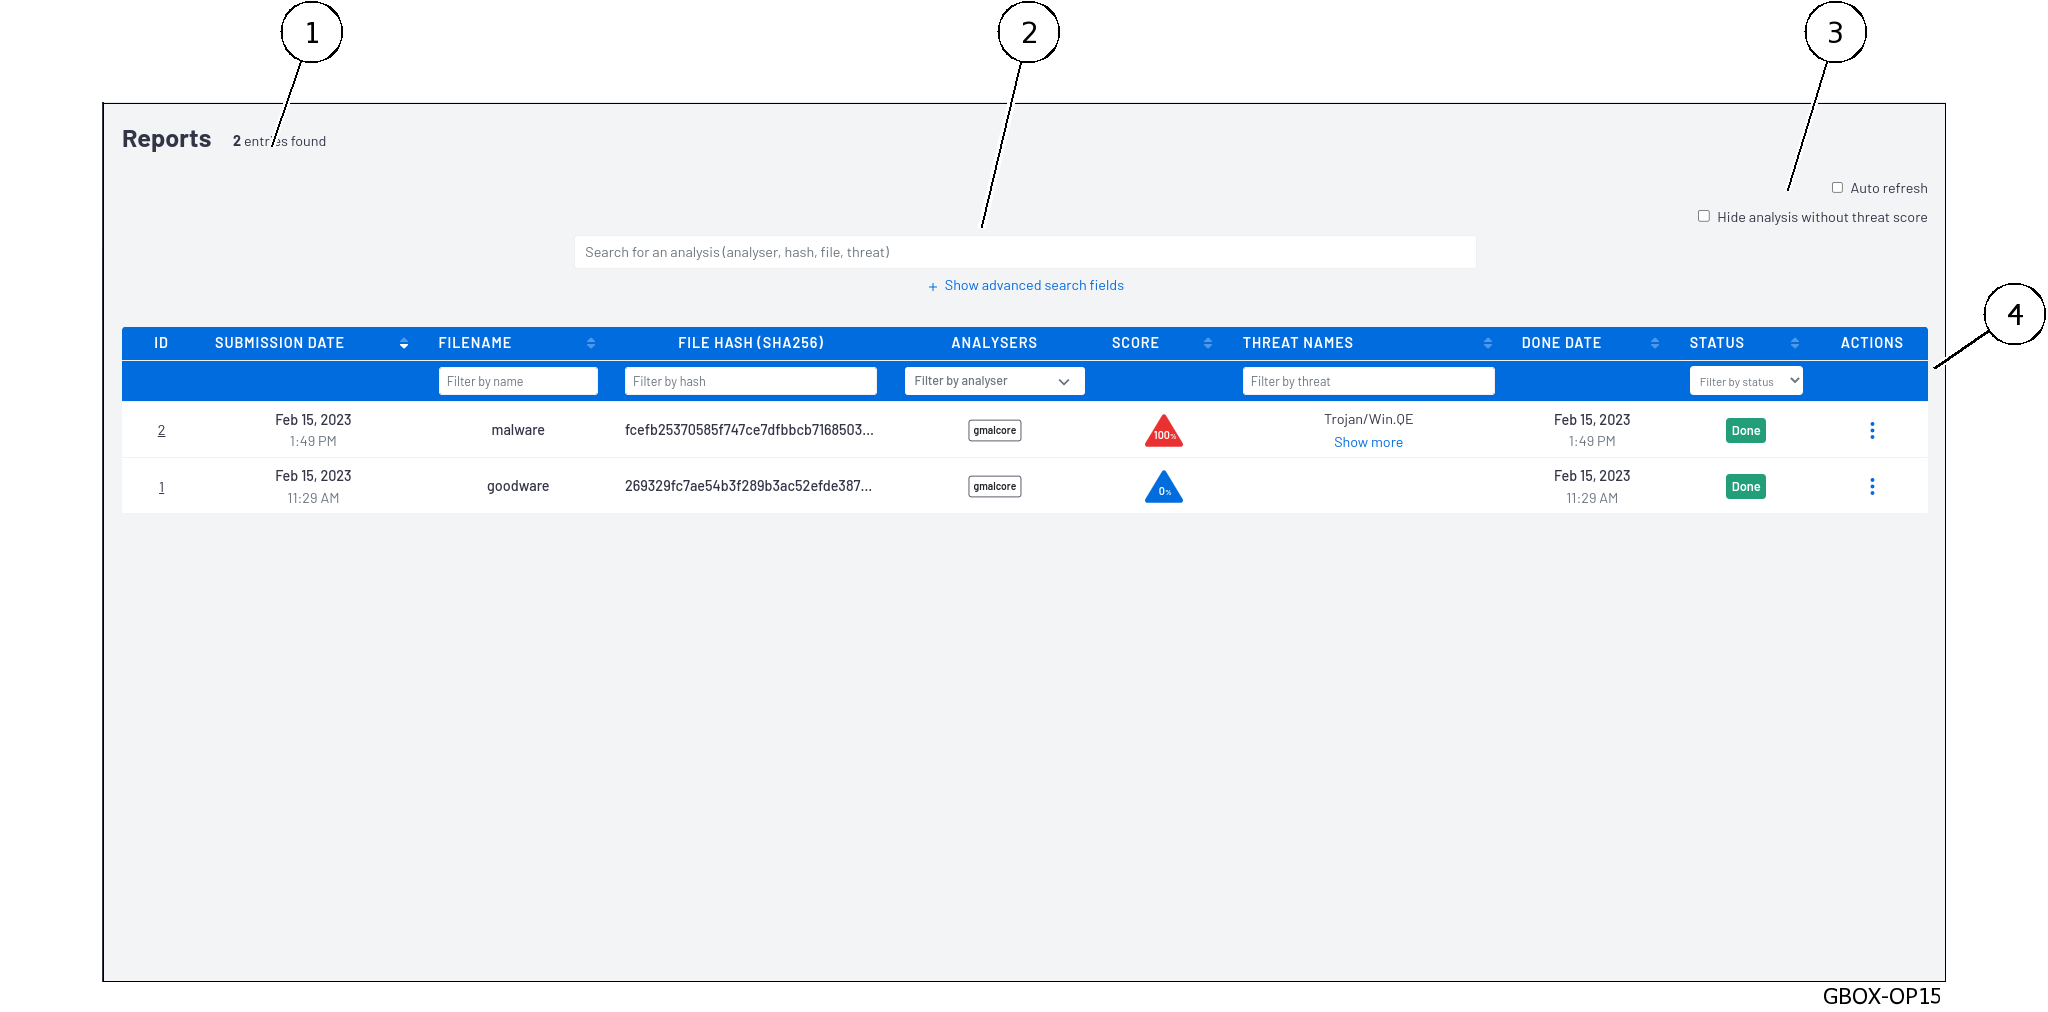
`Reports` button on the navigation bar, the `Reports` screen is displayed.Viewing reports in order to analyse the results
Filter them
Export reports in pdf format
Download the analysed file
It includes the following main items:
Marker |
Name |
|---|---|
1 |
Number of reports in the log (here 2) |
2 |
Area enabling searches in reports |
3 |
Configuration zone |
4 |
Detailed reports area |
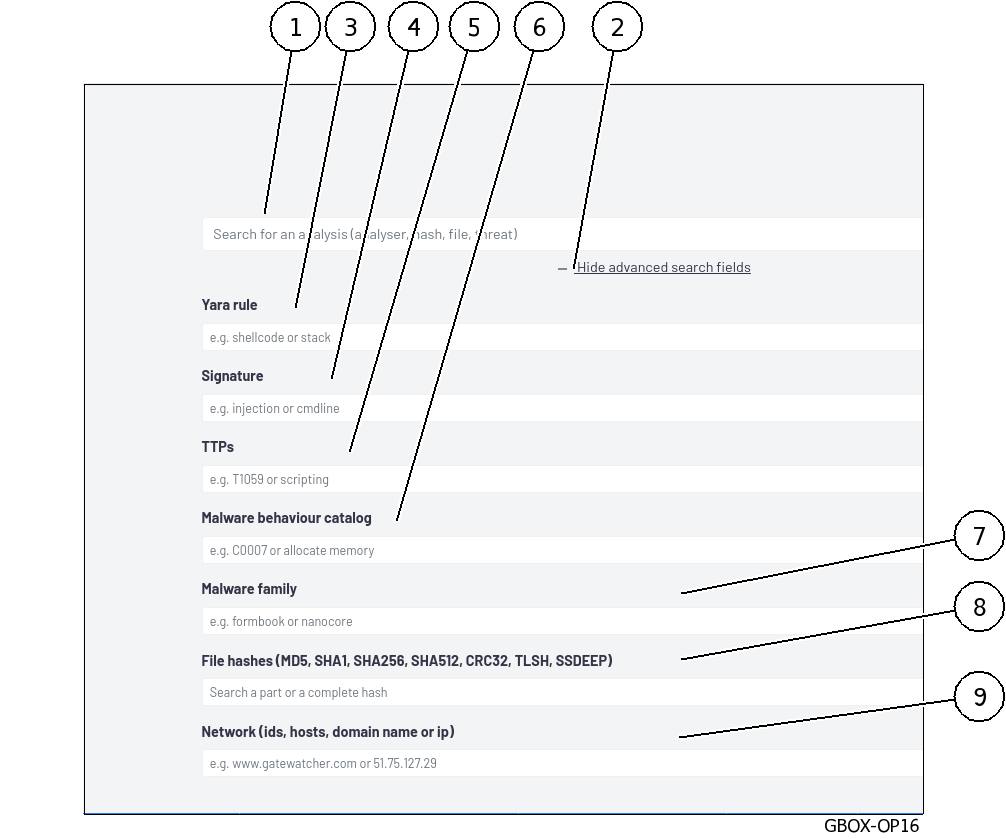
5.2.4.2. Zone enabling searches
This zone enables reports to be filtered using the following criteria.
Marker |
Field |
Description |
|---|---|---|
1 |
|
Filters reports according to the entered input. The filter is applied to the |
2 |
|
Show / hide advanced search fields |
3 |
|
Yara rule (for example shellcode or stack) |
4 |
|
Signature (injection or cmdline, for example) |
5 |
|
Tactics, Technique, Procedure (e.g. T1059 or script) |
6 |
|
Catalogue of malicious behaviour (e.g. C0007 or memory allocation) |
7 |
|
Malware family (e.g. formware or nanocore) |
8 |
|
All or part of the file hash (MD5, SHA1, SHA256, SHA512, CRC32, TLSH, SSDEEP) |
9 |
|
Network settings (ids, hosts, domain name or ip) |
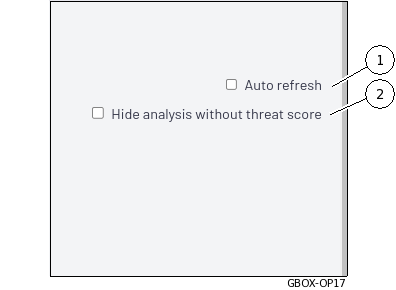
5.2.4.3. Configuration zone
This zone enables configuring the report postings.
Marker |
Name |
Description |
|---|---|---|
1 |
|
Automatic renewal |
2 |
|
Conceals the analysis if there is no threat score |
Note
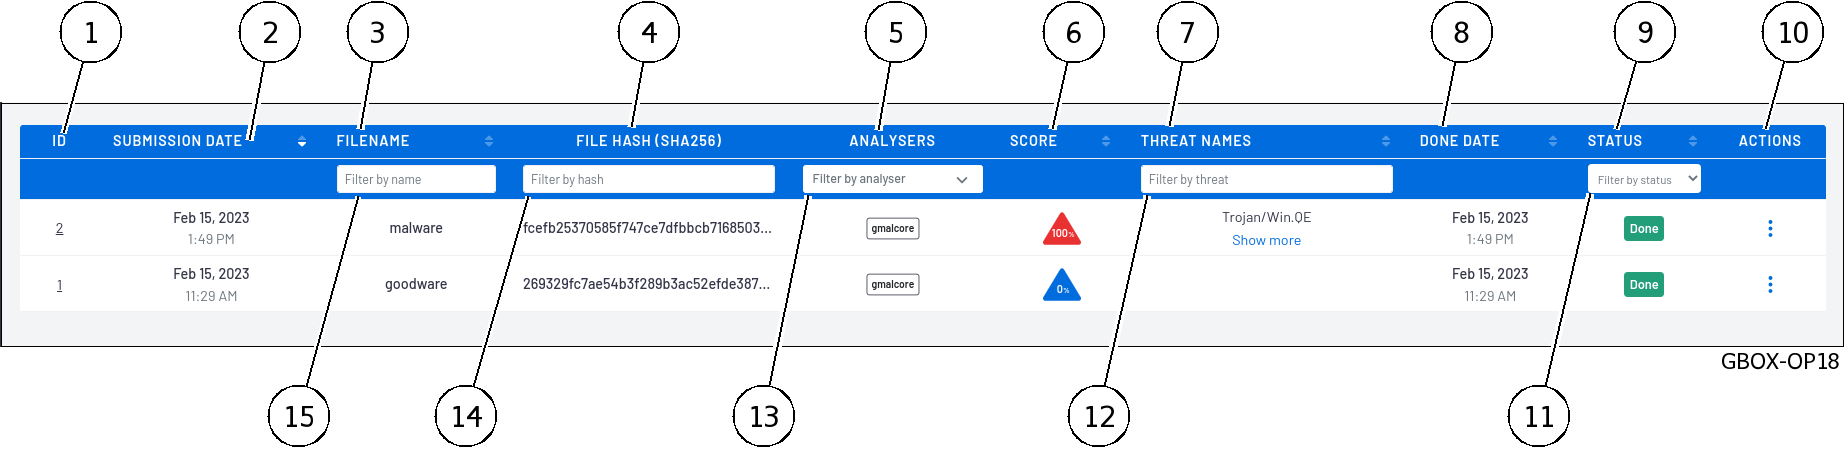
5.2.4.4. Reports area
Note
The information listed in the table below are the same fields as in the reports on the `Home` screen.
Marker |
Name |
Description |
|---|---|---|
1 |
|
Analysis number.
The listed reports are sorted from the most recent to the earliest.
Clicking on this field opens the
`Analysis report` page for this report |
2 |
|
Time and date of the analysis submission |
3 |
|
Name of the analysed file
Clicking on this field copies the name to the clipboard
|
4 |
|
SHA256 of the file
Clicking on this field copies the hash to the clipboard
|
5 |
|
Indicates the name of the engines used for the analysis |
6 |
|
Global threat analysis score calculated from the analysis score reported by the various engines |
7 |
|
Name of the threat reported by the gmalcore module (or n/a)
| Clicking on this field copies the hash to the clipboard
|
8 |
|
End date and time of the analysis |
9 |
|
Overall status of the analysis, either Done, In Progress, In queue, or Error
In the event of an error, further information is available in the analysis report
|
10 |
|
Possible actions: download the report in pdf format |
The fields below are additional fields enabling report filtering.
Marker |
Name |
Description |
|---|---|---|
11 |
|
Enables filtering of reports with this status to be selected from the list |
12 |
|
Enables filtering of reports with this threat name to be entered |
13 |
|
Enables filtering of reports with an engine name to be selected from the list |
14 |
|
Enables filtering of reports with this hash to be entered |
15 |
|
Enables reports to be filtered by the file name to be entered |
5.2.4.5. Detailed report
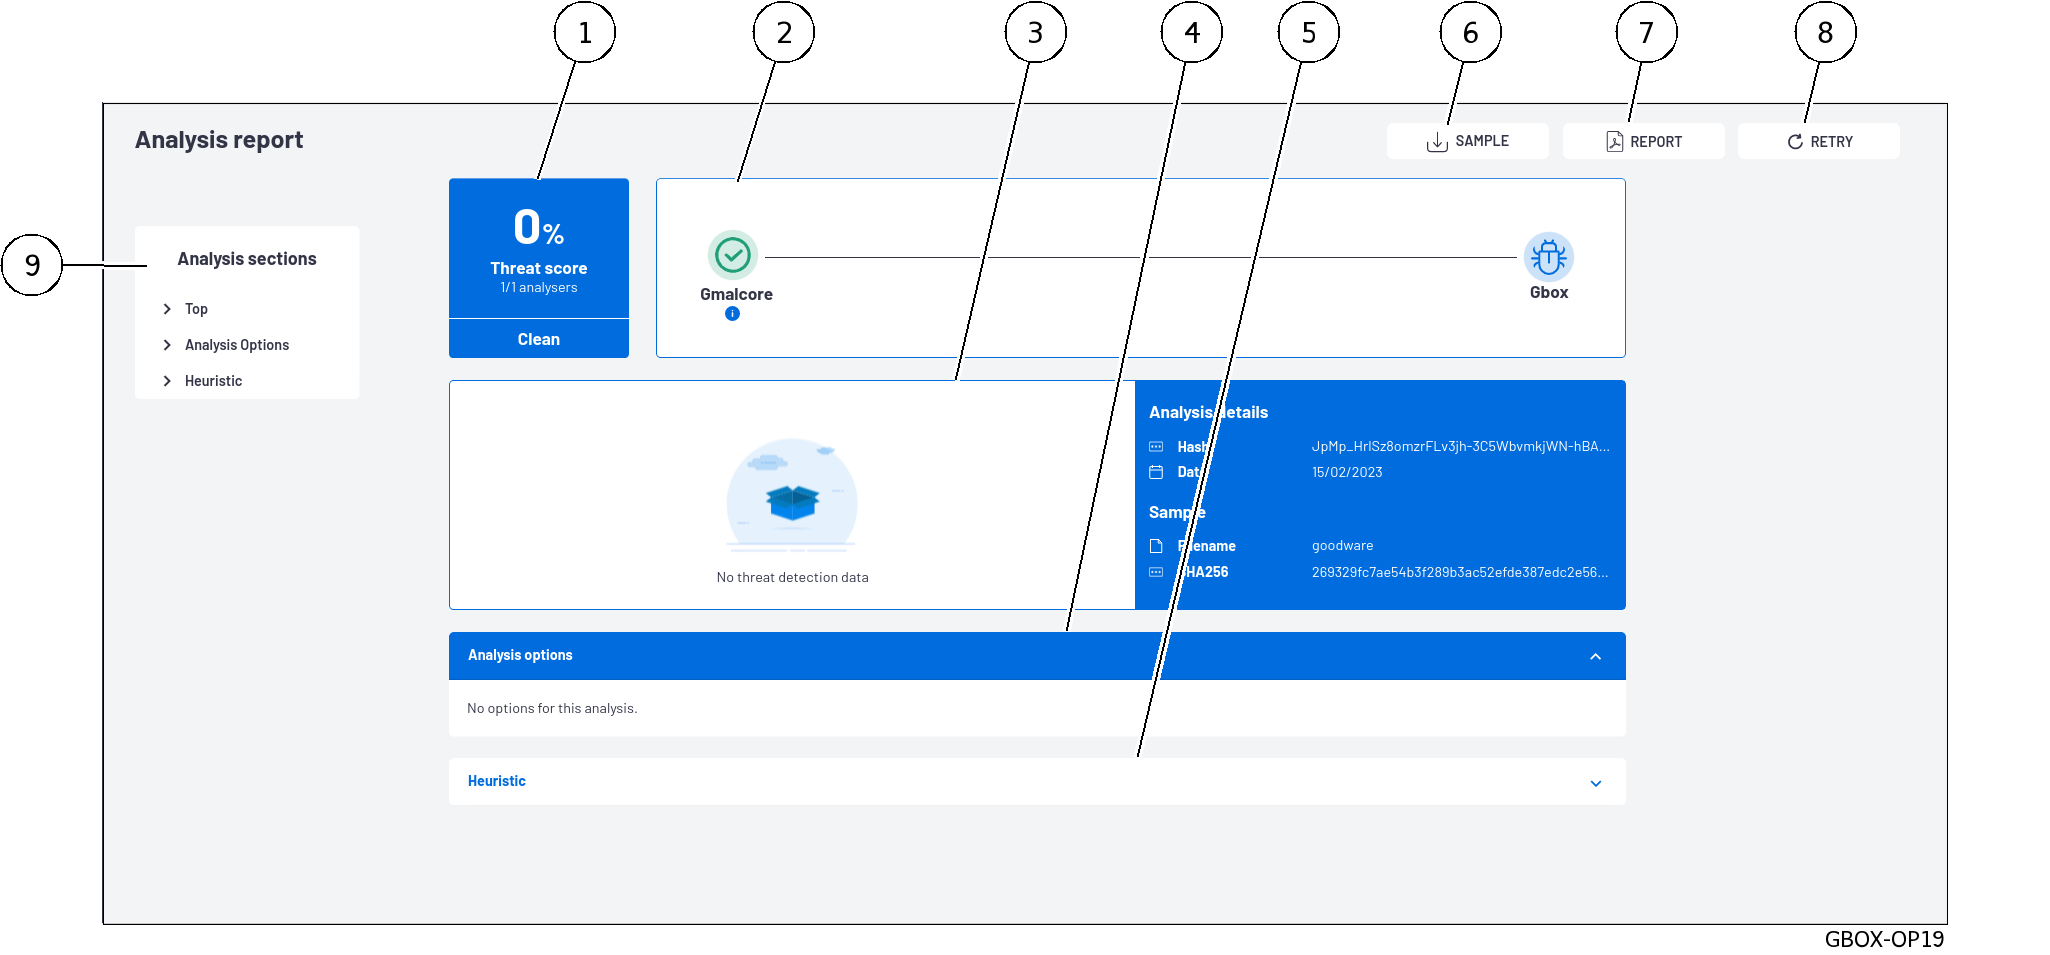
5.2.4.5.1. Information included in this report
The information contained in this report is:
Marker
Description
1
Summary of the analysis results:
The number of engines involved (here 1/1 analysers)
overall status (healthy, suspicious, or malicious): here Clean or healthy
A score is only provided for the Gmalcore and Goasm engines
2
Summary of the analysis stages:
The list of engines used: here Gmalcore
The results of loading the file for each of the engines: here for Gmalcore, the tick indicates that loading was successful
on the right, the result of the analysis: here the icon indicates OK
3
Information includes:
A chart (see note below)
The analysis (hash and date)
The file (name, sha256)
4 and 5
`Analysis options`and`Heuristic`sections are displayed. This section can be folded/unfolded6
`SAMPLE`button enables you to download the analysed file.he downloaded file is compressed and protected by a password (the password is infected).Once decompressed, the file analysed will have a .sample extension.7
The
`REPORT`button enables downloading the report in pdf format.8
The
`RETRY`button enables re-running the analysis of this file with this or another template.9
`Analysis sections`include shortcuts for opening these sections and refocusing the display.These sections provide details of the analyses from the engines defined in the analysis model.This information enables an analyst to obtain a more precise idea of the anatomy and behaviour of the file when it is opened and executed.In this example, only the`Top`,`Analysis options`and`Heuristic`sections are displayed.Depending on the combination of engines employed, some sections may be omitted from this list: details are provided in the table below.
`ALL ARTEFACTS`button enables downloading of artefacts resulting from the analysis, such as memory dump, network capture (pcap), character strings detected.This section also enables the removal of artefacts.This button is only available if the Gnest engine is active.
5.2.4.5.2. List of sections included in the `Analysis sections`
Section title |
Description |
Is activated by the engine |
|---|---|---|
|
Shortcut to the top section of the report, i.e. sections (1) to (3). |
All engines |
|
Option values used for analysis |
Grip and Gnest |
|
List of actions performed, including files, registry, network, processes, and so on. |
GNEST |
|
TTPs analyse how a malicious actor operates. They describe the way cyber attackers orchestrate, execute, and manage operational attacks.
TTPs contextualise a threat. They reveal the steps or actions taken by malicious actors when exfiltrating data, for example.
|
GNEST |
|
Metadata |
GRIP |
|
Information about the file, including size, various hashes, type, etc. |
GNEST |
|
List of engines (Entry#x) and name of the threat reported by the Gmalcore module (or n/a) |
Gmalcore |
|
Shellcode detection result |
GOASM |
|
List of yara signatures corresponding to the analysed file |
Gnest |
|
Graphical representation of the process tree |
Gnest |
5.2.4.5.3. Chart details
Note
The chart is only available if Gnest is part of the model. The data required for the chart is generated by this engine.
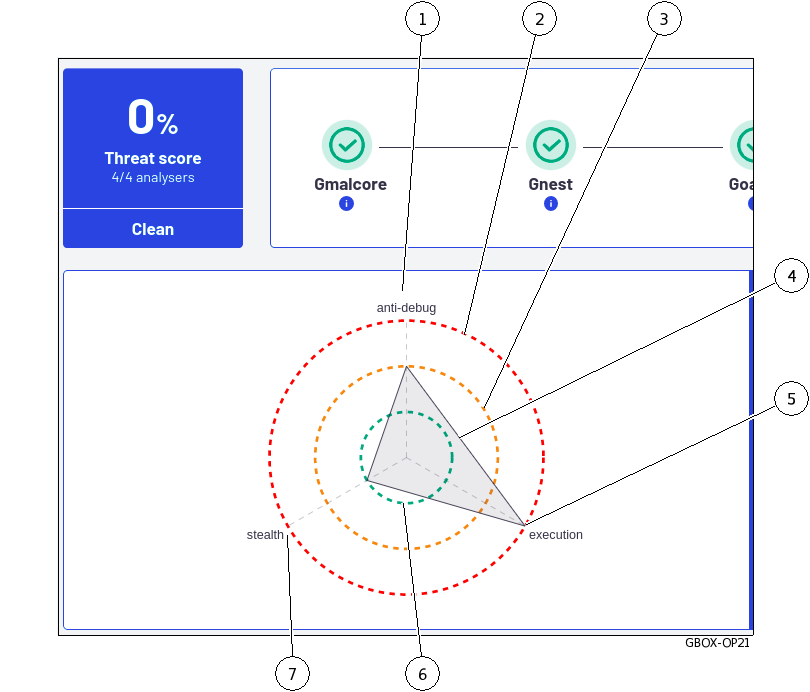
This graph enables viewing the dangerousness of the file analysed:
The category of seriousness is defined by the axes (1) (5) and (7): titles and number of axes are provided by the engines
The degree of danger is indicated by the concentric circles.
The central circle (6) indicates the healthy level
The middle circle (3) indicates the suspicious level
The outer circle (2) indicates the malicious level
malicious on the
`execution`axis (5)suspicious in the
`antidebug`axis (1)healthy on the
`stealth`axis (7)
For an analysis of a report, see the Procedure to analyse the contents of a report.