2.1.4. Malicious Powershell detect engine
2.1.4.1. Introduction
2.1.4.1.1. For what types of threats is this engine designed?
This is a very common tool in Windows PC or server farms
It does not necessarily pass through a file
Often obfuscated to avoid signature detection
Legitimate uses of PowerShell may be considered malicious behavior
2.1.4.1.2. How does this particular engine detect threats?
The detection of malicious powershell scripts is carried out in several steps:
- The first step is to analyze the form, looking for obfuscation of the powershell script.Malicious scripts are usually obfuscated and legitimate scripts are not supposed to be, this step helps to avoid false positives.
- The second step is to scan the content of the powershell script for potentially malicious commands.This step undoes the most common obfuscation techniques to characterize the threat.
2.1.4.1.3. How does Malicious Powershell Detect engine work in the GCenter?
The engine:
Analyzes the events sent by the GCap (for further details see Malicious Powershell Detect engine input data)
Analyzes these events (for further details see How does this particular engine detect threats?)
Generates alerts (for further details see Events generated)
2.1.4.1.3.1. Malicious Powershell Detect engine input data
2.1.4.2. Events generated
- In the main interface named WebUI of the GCenter in the
`Alerts`screen:The main interface named WebUI is described in Overview of the WEB UI.- To display only these alerts, select the
`Malicious Powershell`engine filter then validate.See the presentation of the WebUI `Alerts` screen.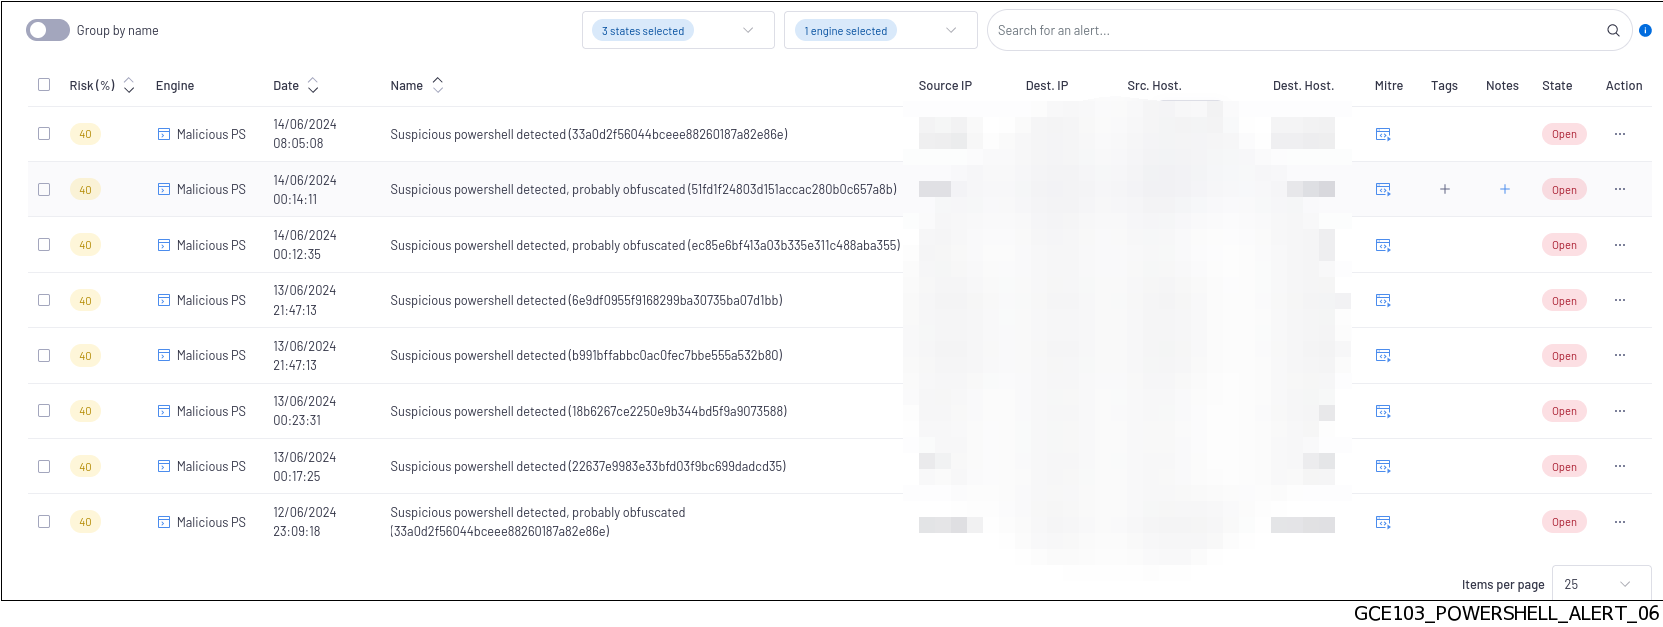
`Alert details`window is displayed.The detailed information of this alert is displayed in Example of a Malicious Powershell detect alert in the WebUIThe displayed counters are given in the Engine log data structure appendix.
`Group by name`mode is activated, the name of the aggregated alerts and their number are displayed.Click on a grouping of alerts to display the list.`Group by name`mode is disabled, different Source and Destination information is displayed for each alert.`Tags`and`Notes`are also visible and editable.The various Quick Access`Actions`are available for each alert.
- In the interface named Kibana UI:
- In the
`Alerts`screen of the WebUI, select the`Malicious Powershell`engine filter then validate.See the presentation of the WebUI `Alerts` screen.
- After selecting the alert, click on the
`Open powershell engine analytics`command of the`Actions`menu.Kibana is opened on the`Malicious Powershell`category of the`Alerts `section: in the`Overview`tab, the database displays all alerts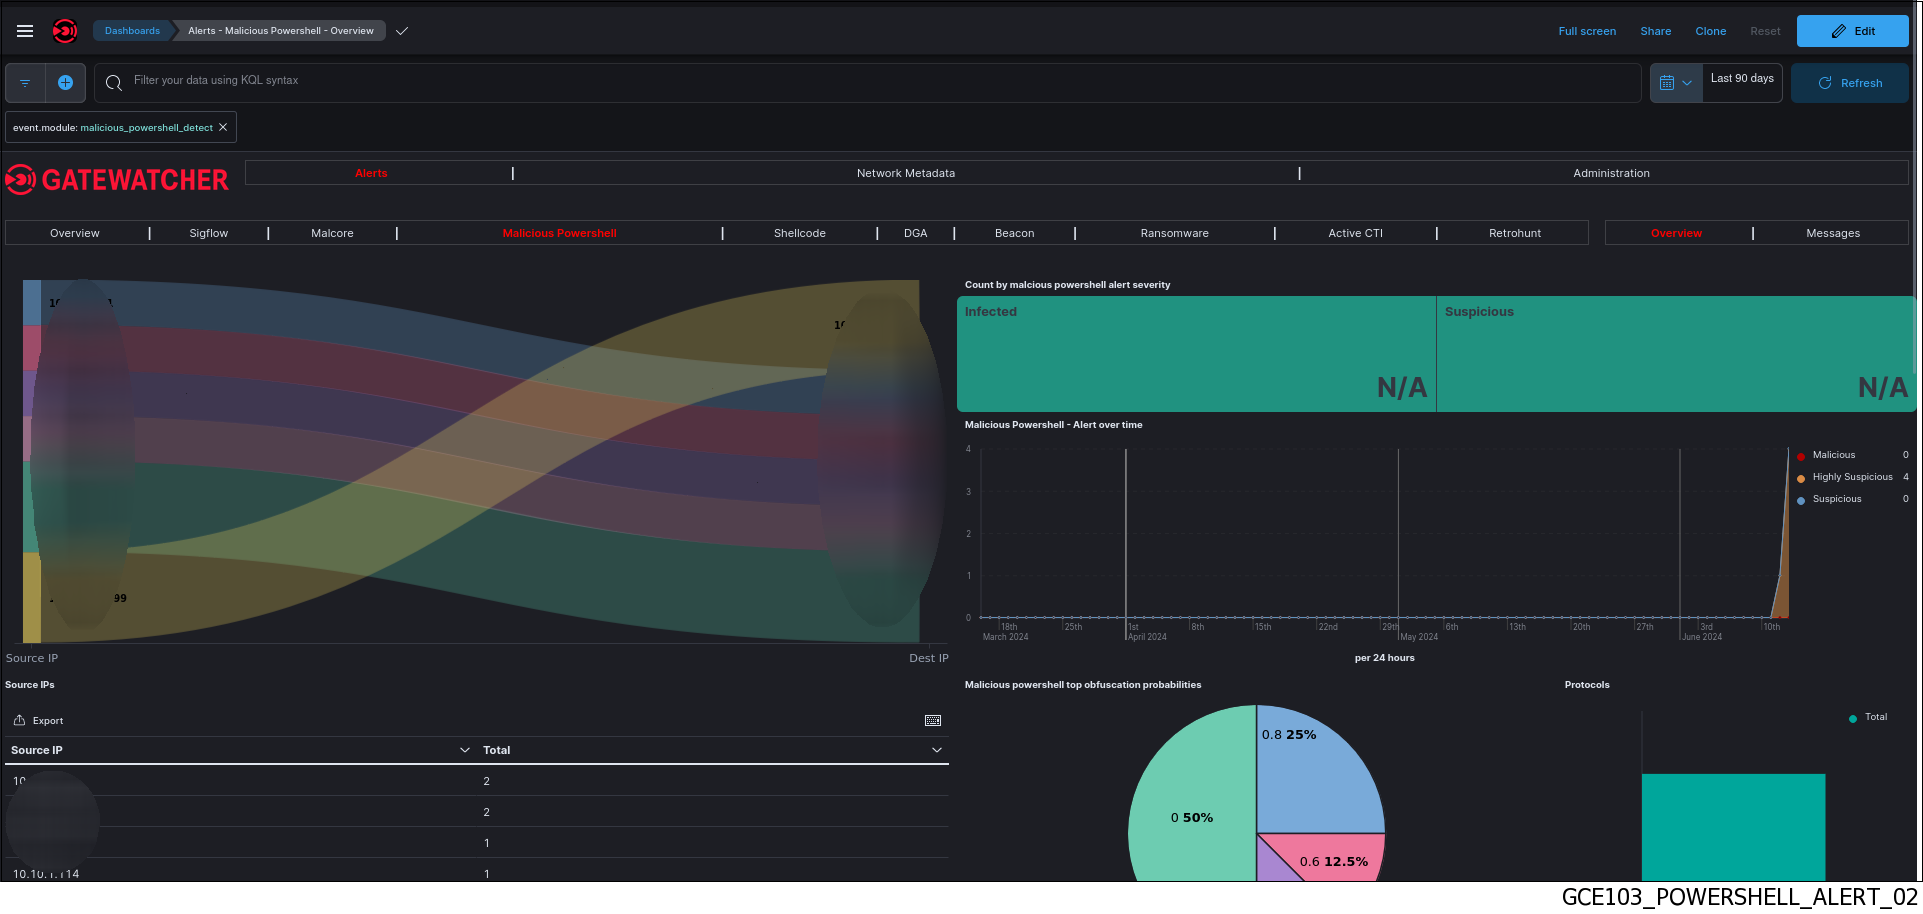 The interface displayed is the interface named Kibana UI (described in Overview of the Kibana GUI).
 Click on the
`Messages`tab (1).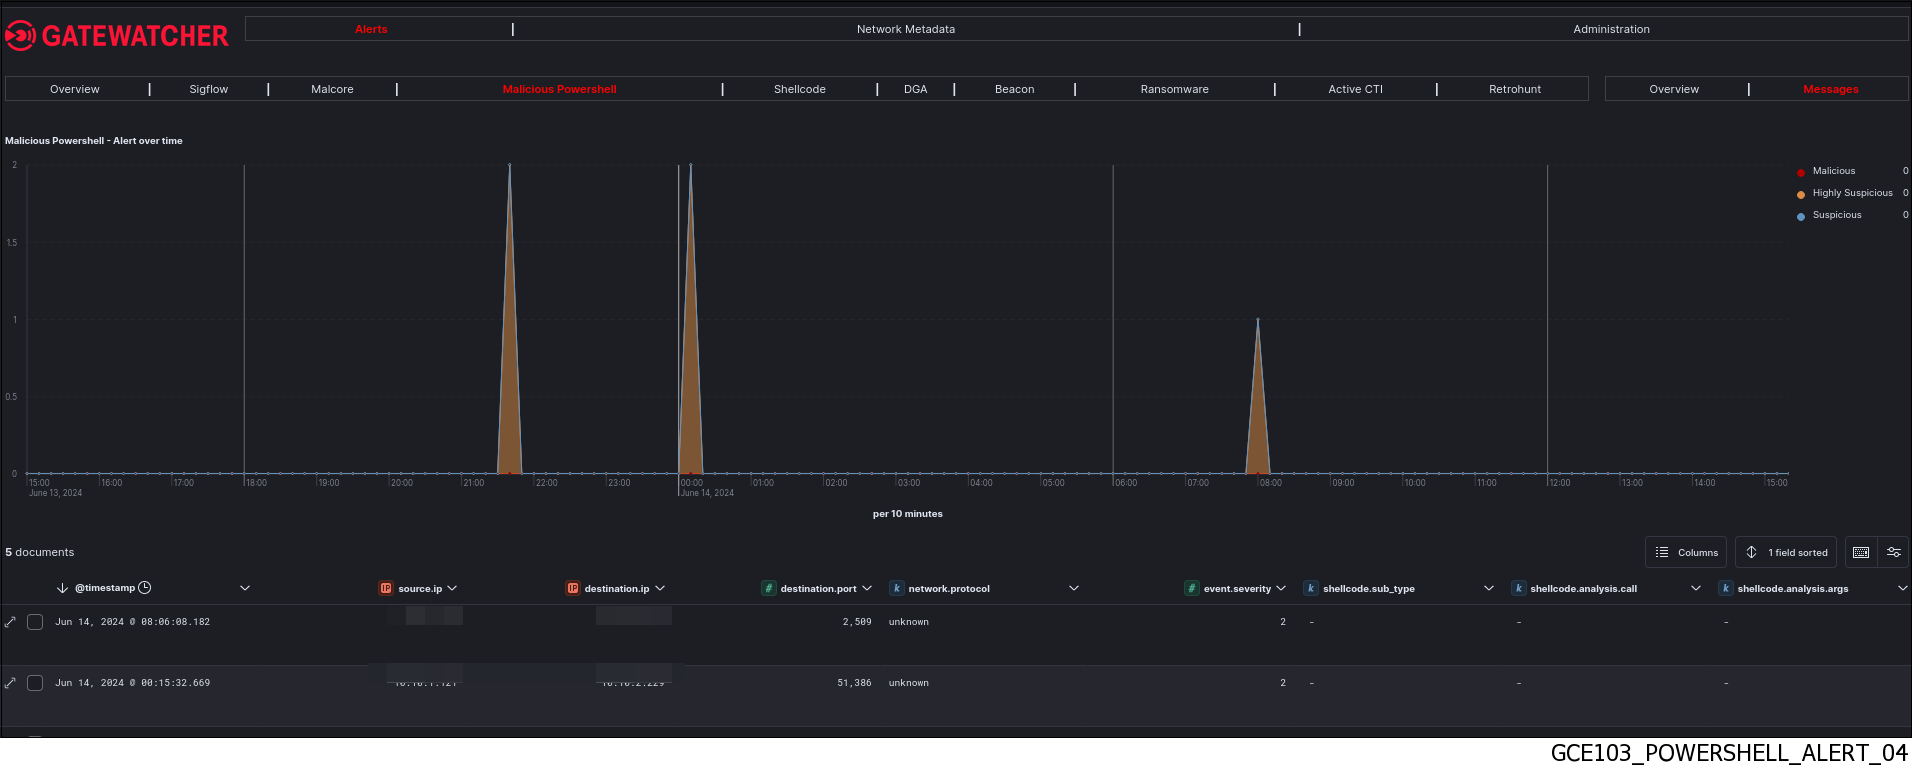
To consult information about a specific alert:
- Click on the toggle icon (1) on the left of the Alert.The expanded document (2) is displayed.
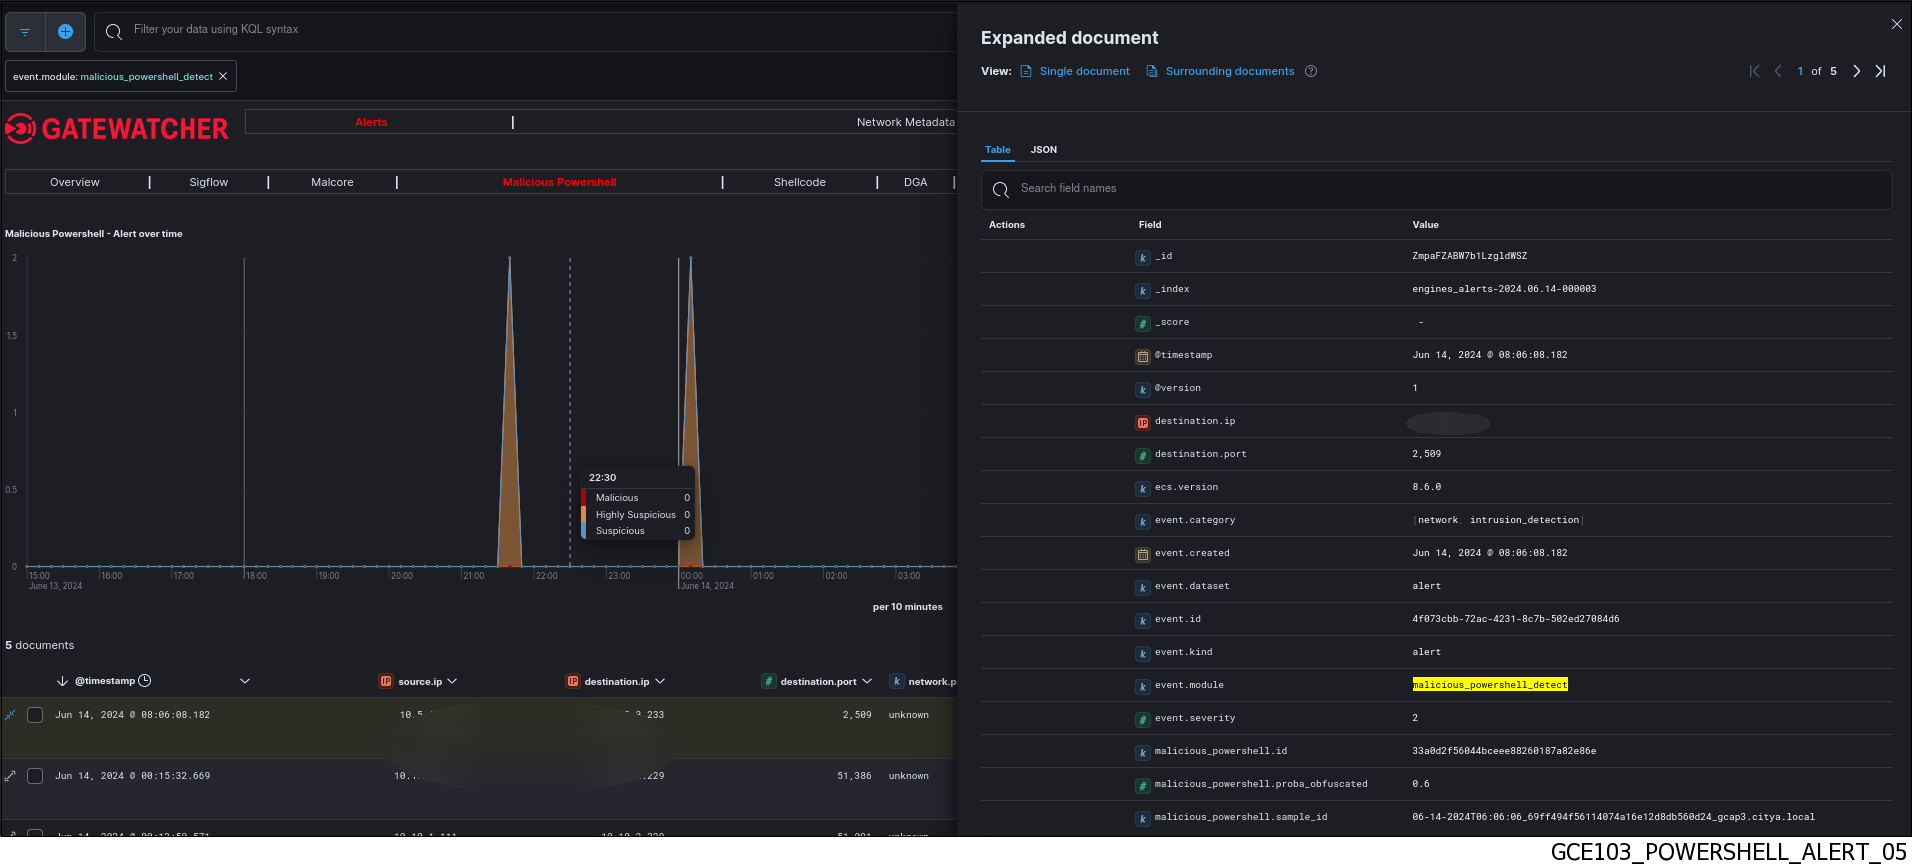 The detailed information of this alert can be viewed in table or json format (see the Malicious Powershell log data structure).The displayed counters are given in the Engine log data structure appendix.
Note
The Kibana UI can also be accessed without any filters via the
`Hunting`icon on the left side menu bar in the WebUI.
2.1.4.2.1. Example of a Malicious Powershell detect alert in the WebUI
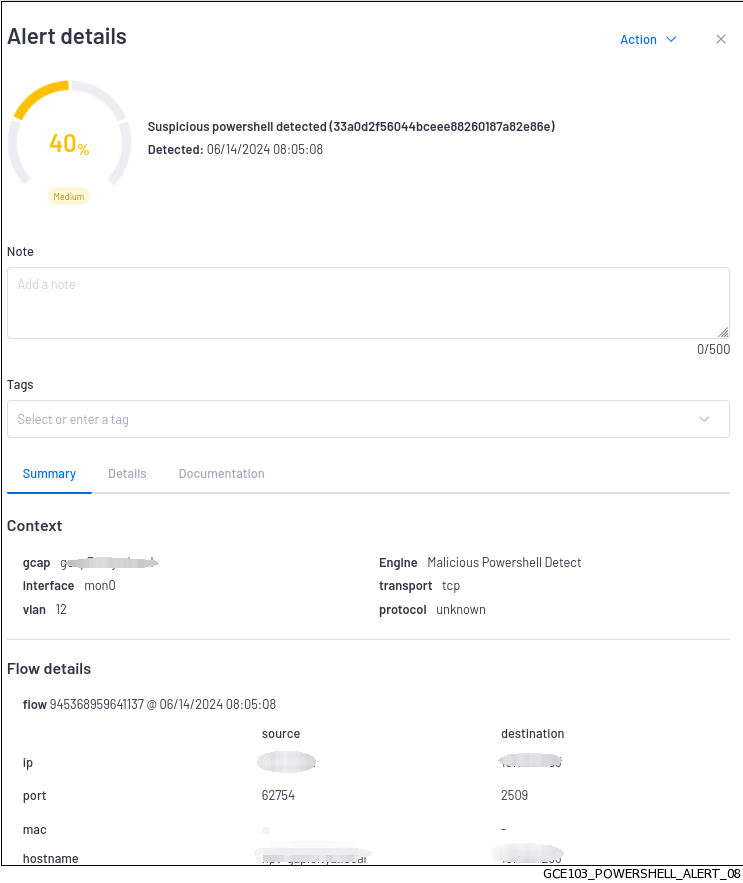
`Alert details` window is given in the `Alert details` window.2.1.4.2.2. Malicious Powershell log data structure
The logs are composed of different parts:
The header part
The source part defined by "_source"
The field part defined by "_fields"
This information is displayed in the `Expanded document` screen of Kibana.
2.1.4.2.2.1. The header part of Malicious Powershell logs
The header section contains:
"_index": "engines_alerts-2024.12.04-000030",
"_id": "0KIEkpMBe7GX5B2fI_RU",
"_version": 1,
"_score": 0,
The detailed information is given in the table (Counters of the header part of logs).
2.1.4.2.2.2. The source part of Malicious Powershell logs
The source part is defined by "_source" in the logs.
Note
`Extended document` screen on the Kibana interface.The example given here is a Kibana example.
"malicious_powershell": {
  "sample_id": "12-04-2024T14:12:40_03afe38854c8443db03807bcc51cf935_gcap.gatewatcher.com",
  "score_details": {
    "InvokeRestMethod": 0,
    "StreamWriter": 0,
    "CharInt": 6,
    "AddContent": 0,
    "InvokeExpression": 100,
    "StrCat": 4,
    "StreamReader": 0,
    "SystemIOFile": 0,
    "InvokeWebRequest": 0,
    "StrJoin": 6,
    "WebClientInvokation": 20,
    "StrReplace": 0,
    "SetContent": 0,
    "GetContent": 0,
    "FmtStr": 8,
    "StartBitsTransfer": 0,
    "Base64": 188
  },
  "proba_obfuscated": 0.6,
  "score": 332,
  "id": "b5c38e2159f80a5a3076a353360cb5f1"
},
"event": {
  "created": "2024-12-04T14:12:44.750657+0000",
  "dataset": "alert",
  "module": "malicious_powershell_detect",
  "severity": 1,
  "kind": "alert",
  "category": [
    "network",
    "intrusion_detection"
  ],
  "id": "081d78f9-81f2-4408-84bf-2c8d6a8e5939"
},
"@version": "1",
"source": {
  "port": 33698,
  "ip": "x.y.z.A",
},
"ecs": {
  "version": "8.6.0"
},
"observer": {
  "log_format_version": "1.0.0",
  "hostname": "gcenter.domain",
  "vendor": "gatewatcher",
  "gcap": {
    "ingress": {
      "interface": {
        "name": "monvirt"
      }
    },
    "hostname": "gcap",
    "version": "2.5.x."
  },
  "product": "gcenter",
  "uuid": "fc1e66e3-a397-5eb4-9277-754be778f317",
  "version": "2.5.x"
},
"destination": {
  "port": 9999,
  "ip": "x.A.V.X"
},
"@timestamp": "2024-12-04T14:12:44.750Z",
"network": {
  "protocol": "unknown",
  "transport": "tcp",
  "timestamp": "2024-12-04T14:11:36.408774+0000",
  "flow_id": 2227663757209674
2.1.4.2.2.3. List of counters of the alert
Note
The alert counters are visible:
In the
`Alert details`screen of the WebUIIn the
`Expanded document`screen of KibanaIn the export to the SIEM
The detailed information is given in the table (Counters of the source part of logs).
2.1.4.3. Management of the engine
2.1.4.3.3. Engine configuration
See the screen description, see the `Malicious Powershell detect` screen (Malicious Powershell command)
See the Setting up the Malicious Powershell detect engine procedure.