2.1.8. Active CTI engine
2.1.8.1. CTI module overview
A database of Indicators Of Compromise named Gatewatcher CTI
The Active CTI engine: it generates Sigflow rules on the basis of the database of Indicators Of Compromise in order to raise alerts
The Retro hunt engine: it searches the Indicators Of Compromise (defined in the database) in metadata (corresponding of the network flow captured by Sigflow)
Note
An additional license is required to activate this module. It is therefore not automatically activated in the solution.
2.1.8.2. Introduction
2.1.8.2.1. For what types of threats is this engine designed?
The active CTI engine is designed to detect:
Malicious URLs
Malicious domain names
2.1.8.2.2. How does this particular engine detect threats?
2.1.8.2.3. How does Active CTI work in the GCenter?
2.1.8.3. Events generated
- In the main interface named WebUI of the GCenter in the
`Alerts`screenThe main interface named WebUI is described in Overview of the WEB UI.- To view the alerts, select the
`Active CTI`engine filter.See the presentation of the WebUI `Alerts` screen. - Click on the selected alert.The
`Alert details`window is displayed.The detailed information of this alert is displayed in Example of an Active CTI alert in Kibana.The displayed counters are given in the Engine log data structure appendix.
- In the interface named Kibana UI:
- In the main interface WebUI, click on the
`Hunting`icon.The interface displayed is the interface named Kibana UI (described in Overview of the Kibana GUI). - Click on the
`Active CTI`category of the`Alerts`section then the`Overview`or`Messages`tab.
To consult information about a specific alert:
- Click on the toggle icon (1) on the left of the Alert.The expanded document (2) is displayed.
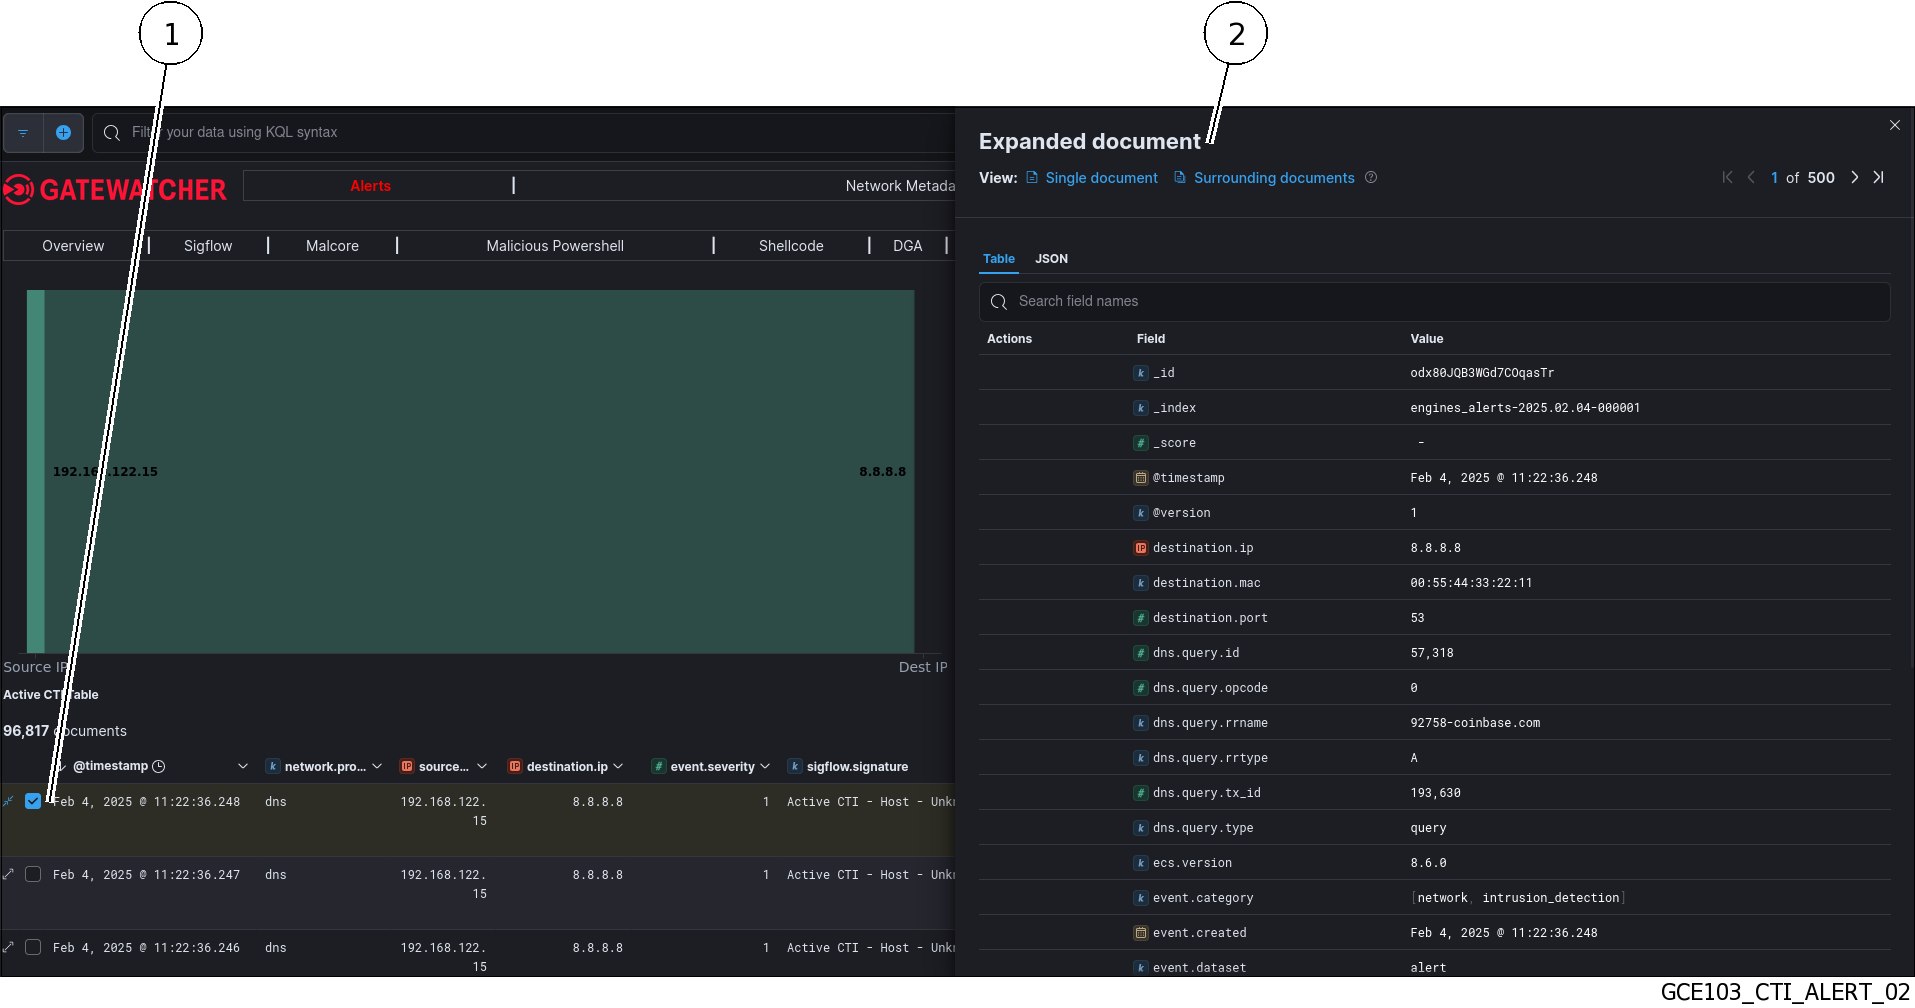 The detailed information of this alert can be viewed in table or json format (see the Active CTI logs data structure).The displayed counters are given in the Engine log data structure appendix.Active CTI alerts are alerts that can be filtered by searching for the term event.module: active_cti in the Kibana search bar.
Note
The Kibana UI can also be accessed without any filters via the
`Hunting`icon on the left side menu bar in the WebUI.
2.1.8.3.1. Example of an Active CTI alert in Kibana
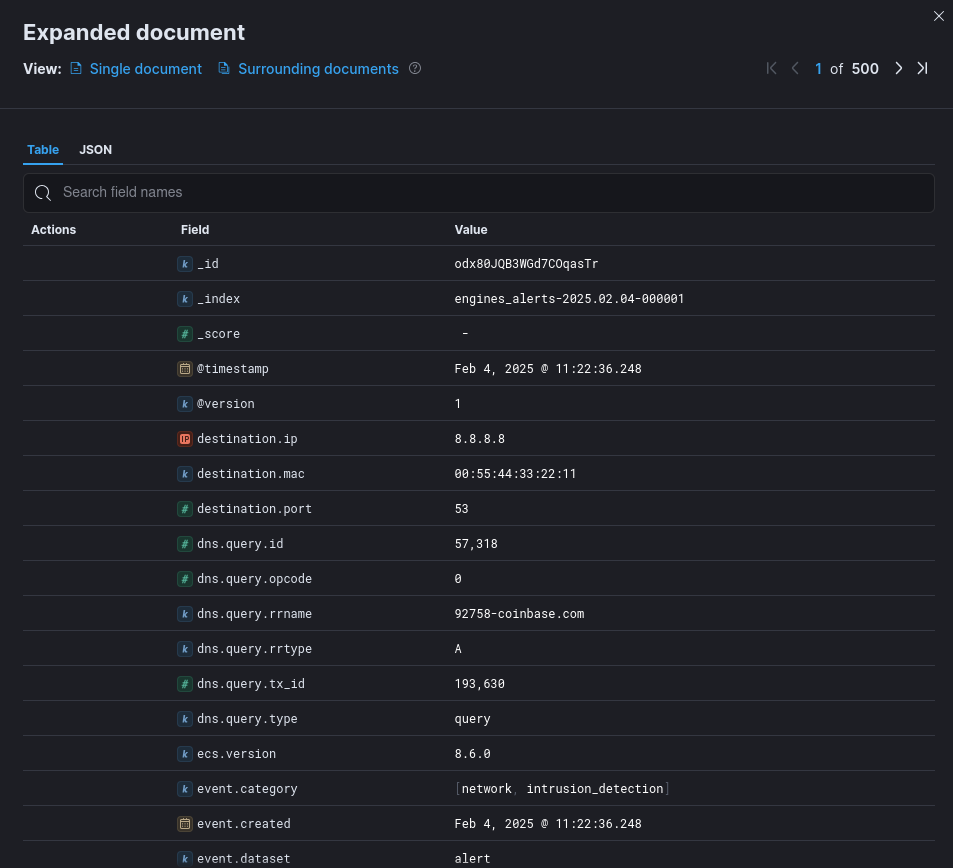
`Alert details` window is given in the `Alert details` window.2.1.8.3.2. Active CTI logs data structure
The logs are composed of different parts:
The header part
The source part defined by "_source"
The field part defined by "_fields
This information is displayed in the `Expanded document` screen of Kibana.
2.1.8.3.2.1. The header part of Active CTI logs
The header section contains:
"_index": "engines_alerts-2025.02.04-000001",
"_id": "odx80JQB3WGd7COqasTr",
"_version": 1,
"_score": 0,
The detailed information is given in the table (Counters of the header part of logs).
2.1.8.3.2.2. The source part of Active CTI logs
The source part is defined by "_source" in the logs.
Note
`Extended document` screen on the Kibana interface.The example given here is a Kibana example.
"@version": "1",
"source": {
  "ip": "x.y.z.a",
  "port": 53,
  "mac": "00:11:22:33:44:55"
},
"network": {
  "protocol": "dns",
  "tx_id": 193630,
  "flow_id": 2201432362562192,
  "transport": "udp",
  "timestamp": "2025-02-04T10:22:36.248783+0000"
},
"destination": {
  "ip": "8.8.8.8",
  "port": 53,
  "mac": "00:55:44:33:22:11"
},
"@timestamp": "2025-02-04T10:22:36.248Z",
"event": {
  "dataset": "alert",
  "created": "2025-02-04T10:22:36.248783+0000",
  "kind": "alert",
  "severity": 1,
  "module": "active_cti",
  "category": [
    "network",
    "intrusion_detection"
  ],
  "id": "d79bff72-01b6-4639-979c-efcb5e6faf23"
},
"sigflow": {
  "payload": "3+YBAAABAAAAAAAADjkyNzU4LWNvaW5iYXNlA2NvbQAAAQAB",
  "signature_id": 1300000773,
  "metadata": {
    "risk": [
      "highly suspicious"
    ],
    "signature_severity": [
      "2"
    ],
    "ioc": [
      "fffc7e75-cb75-4210-a244-669cba3cae06"
    ],
    "updated_at:": [
      "2025_02_04"
    ],
    "created_at:": [
      "2025_02_04"
    ]
  },
  "gid": 1,
  "action": "allowed",
  "rev": 0,
  "stream": 0,
  "payload_printable": ".............92758-coinbase.com.....",
  "signature": "Active CTI - Host - Unknown/Unknown - Unknown family - Unknown threat actor - fffc7e75-cb75-4210-a244-669cba3cae06",
  "category": "Active CTI"
},
"flow": {
  "bytes_toclient": 10843280,
  "pkts_toclient": 96815,
  "bytes_toserver": 7551648,
  "pkts_toserver": 96816,
  "start": "2025-02-04T10:20:39.242320+0000"
},
"ecs": {
  "version": "8.6.0"
},
"dns": {
  "query": [
    {
      "rrname": "92758-coinbase.com",
      "rrtype": "A",
      "tx_id": 193630,
      "opcode": 0,
      "type": "query",
      "id": 57318
    }
  ]
},
"observer": {
  "product": "gcenter",
  "vendor": "gatewatcher",
  "gcap": {
    "hostname": "gcap.gatewatcher.fr",
    "ingress": {
      "interface": {
        "name": "monvirt"
      }
    },
    "version": "2.5.x"
  },
  "hostname": "gcenter.gatewatcher.fr",
  "uuid": "72cbafc7-96d2-203a730252a8",
  "version": "2.5.x",
  "log_format_version": "1.0.0"
2.1.8.3.2.3. List of counters of the alert
Note
The alert counters are visible:
In the
`Alert details`screen of the WebUIIn the
`Expanded document`screen of KibanaIn the export to the SIEM
The detailed information is given in the table (Counters of the source part of logs).
2.1.8.4. Management of the engine
2.1.8.4.1. Viewing the engine status
The current engine status is displayed in the `Health checks` screen.
2.1.8.4.2. CTI update
2.1.8.4.2.1. The database of indicators of compromise
Note
The correlation of indices and metadata will depend on the data retention time configured on the GCenter.
Manual update with cti.gwp package
Online update: the download is performed periodically based on the package posted by Gatewatcher
Local update: the download is performed periodically based on the package in the local repository.
Note
2.1.8.4.2.2. The Active CTI engine update
The engine is updated with each new version of the GCenter.
2.1.8.4.3. Active CTI engine configuration
The configuration interface is used:
To active the Active CTI engine
To modify the engine parameters