2.1.11. Beacon detect engine
2.1.11.1. Introduction
2.1.11.1.1. For what types of threats is this engine designed?
2.1.11.1.2. How does this particular engine detect threats?
The engine detects C&C threats through different HTTP and HTTPS metadata scans:
Identification of statistical distributions indicating periodicity in metadata
The presence of anomalies characterizing the execution of commands
Heuristics to specifically identify certain C&C software
Depending on the configuration used, detection algorithms can withstand the following escape methods:
Data encryption or over-encryption
Random time between each communication
Random data size
Usurpation of known domain names
Some C&C are specifically identified:
Cobalt Strike
BruteRatel
Caldera
Powershell Empire
Sliver
Frequently accessed domains within the infrastructure
Commonly known domains
Generic special domains used in the internal endpoints (example: .local)
Disabling these options increases detection sensitivity and may require adding domains to the ignore destinations list.
2.1.11.1.3. How does the Beacon detect engine work in the GCenter?
The engine:
Retrieves events sent by the GCap (for further details see Beacon detect engine input data)
Analyzes these events (for further details see How does this particular engine detect threats?)
Generates alerts (for further details see Events generated)
2.1.11.1.3.1. Beacon detect engine input data
- HTTP logging and TLS logging must be enabled in the
`Base variables`section of the`Detection strategy/Sigflow engine/Gcaps profiles`menuFor further details of these functions and their activations, see `Base variables` Section of the `GCaps profiles` screen. - The Metadata rate limiter must be disabled for HTTP and TLS protocols in the
`Detection strategy/Sigflow engine/Metadata rate limiter`menuFor further details of its function and the protocols activations, see `Metadata rate limiter` screen.
Important
Activate the HTTP or TLS protocol disables the detection of the Beacon detect engine for these protocols.
For optimal engine operation:
`Base variables`section of the`Detection strategy/Sigflow engine/Gcaps profiles`menuFor further details of these functions and their activations, see the `Base variables` Section of the `GCaps profiles` screen.
Note
To modify the options of the engine: see the Setting up the beacon detect engine
2.1.11.2. Events generated
- In the main interface named WebUI of the GCenter in the
`Alerts`screen.The main interface named WebUI is described in the Overview of the WEB UI.- To display the beacon alerts, select the
`Beacon`engine filter.See the presentation of the WebUI `Alerts` screen.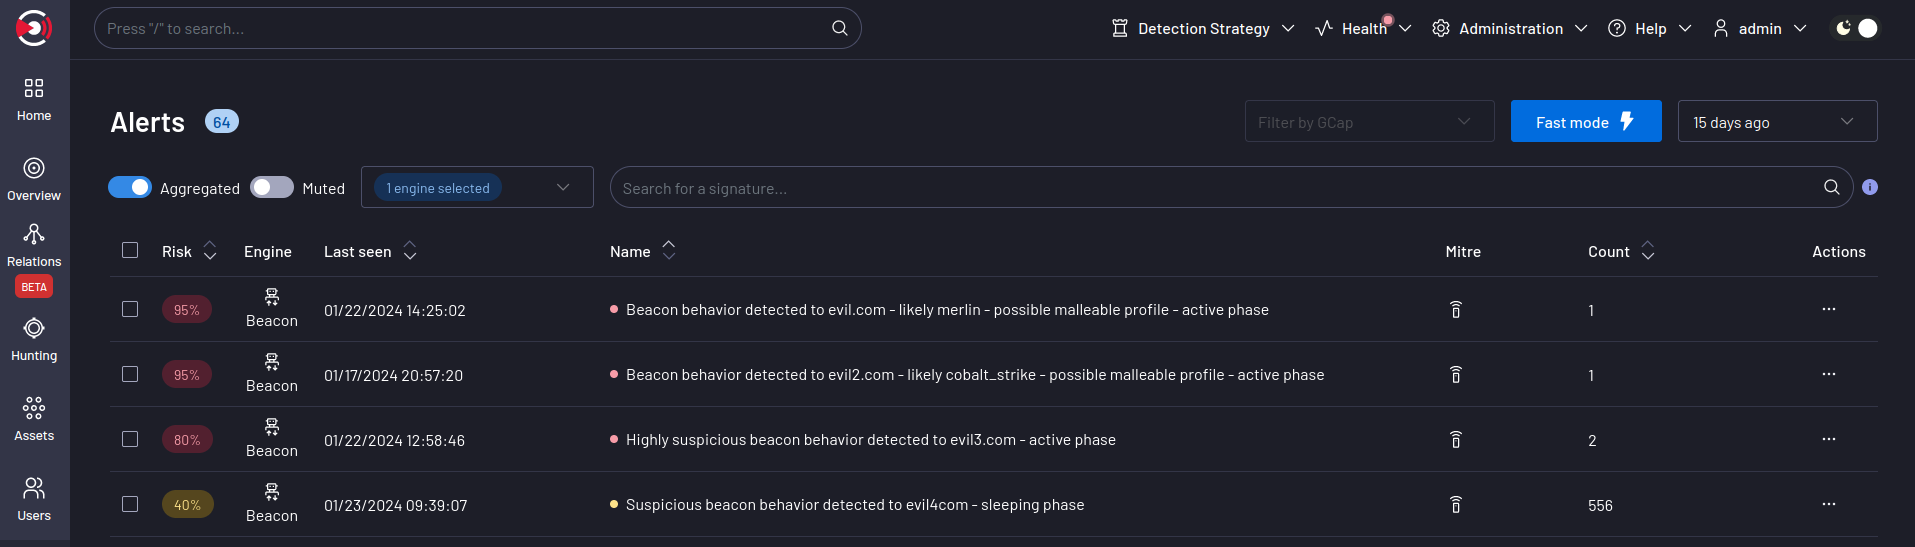
- Click on the selected alert.The
`Alert details`window is displayed.The detailed information of this alert is displayed in Example of a Beacon detect alert in Kibana.
- In the interface named Kibana UI:
- Click on the
`Hunting`icon of the`WebUI`.The interface displayed is the interface named Kibana UI (described in Overview of the Kibana GUI). Click on the ☰ icon and then on
`Discover`Select the
`engines_alerts*`choice in the Data ViewIn the search field, enter
`event.module :"beacon_detect"`filter to display only the alerts of the Beacon detect engine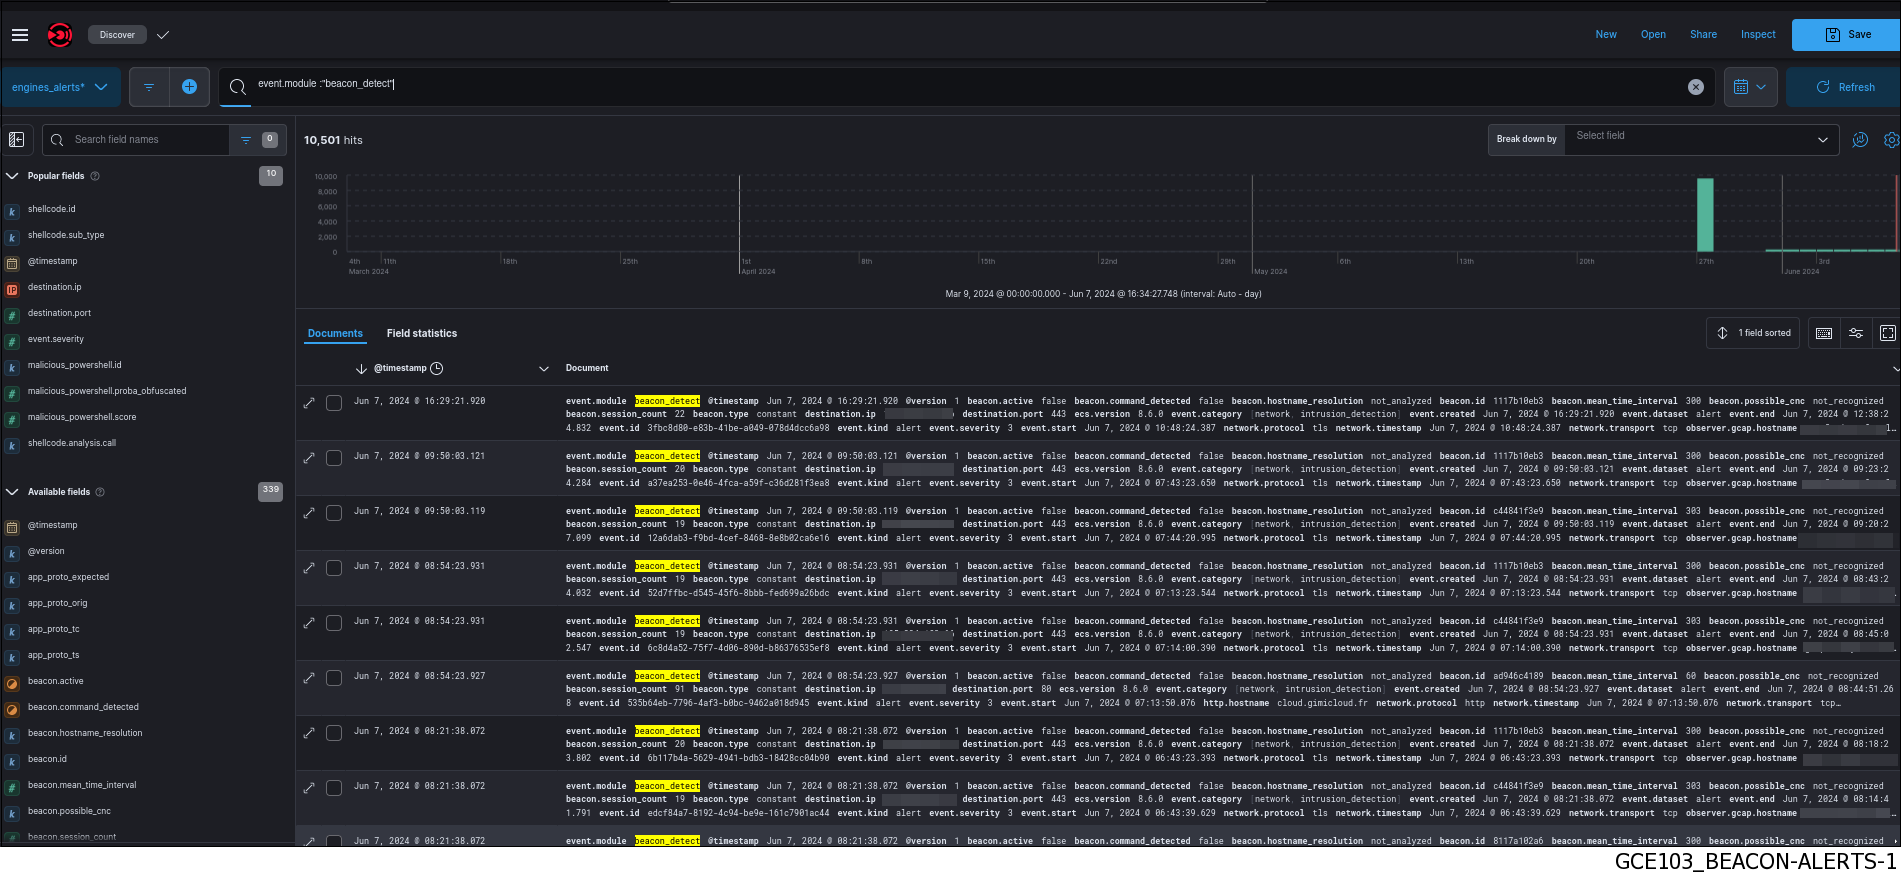
- Click on the toggle icon (1) on the left of the Alert.The expanded document (2) is displayed.
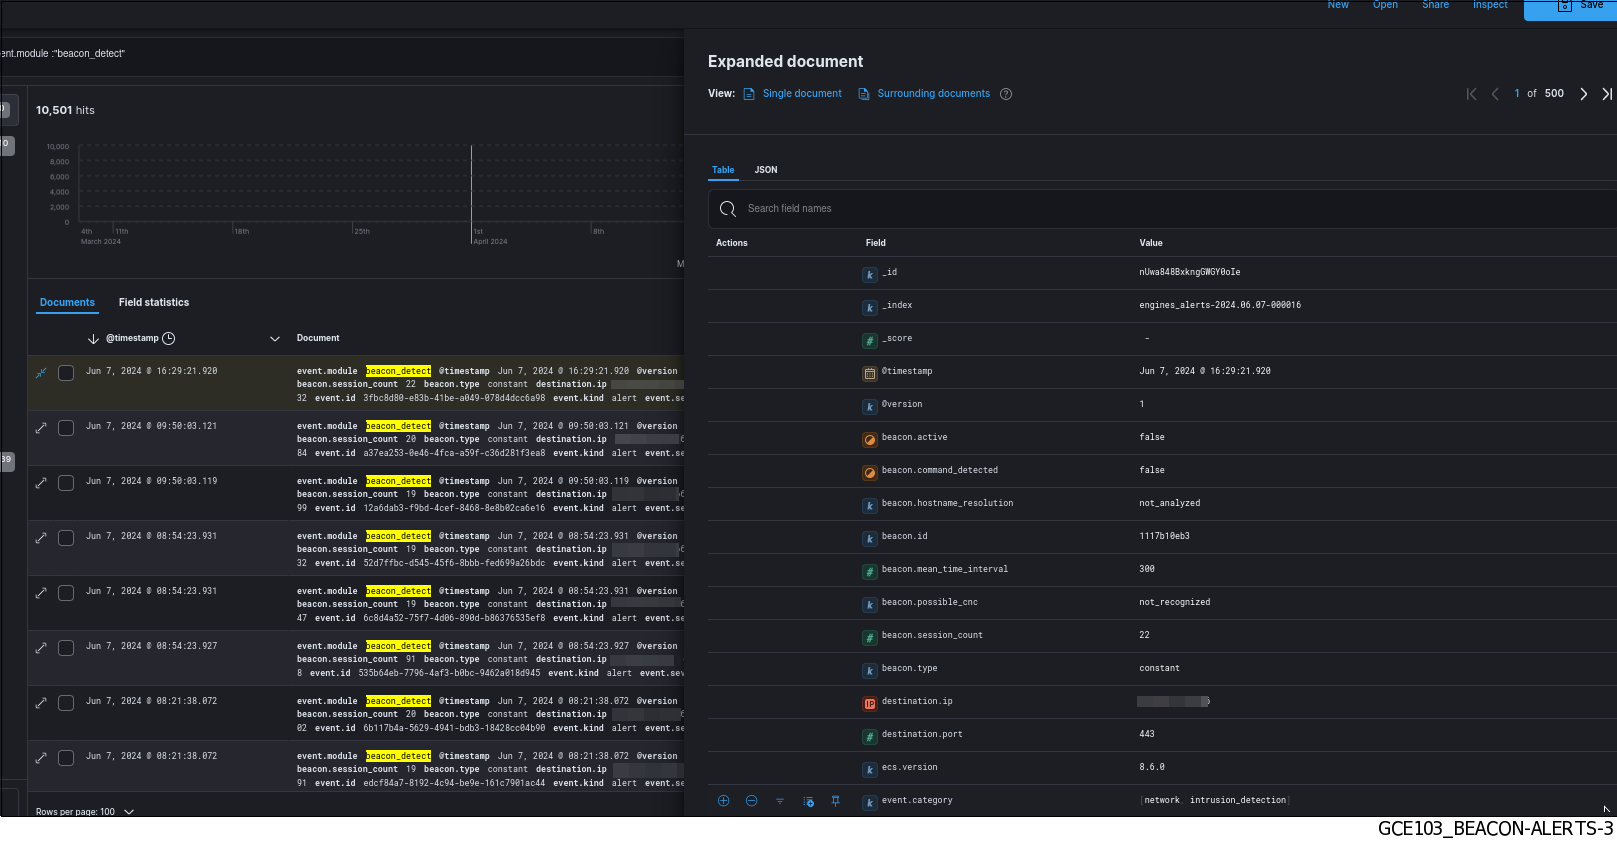 The detailed information of this alert can be viewed in table or json format (see the Beacon detect log data structure).The displayed counters are given in the Engine log data structure appendix.
2.1.11.2.1. Example of a Beacon detect alert in Kibana
`Alert details` window is given in the `Alert details` window.2.1.11.2.2. Beacon detect log data structure
The logs are composed of different parts:
The header part
The source part defined by "_source"
The field part defined by "_fields"
This information is displayed in the `Expanded document` screen of Kibana.
2.1.11.2.2.1. The header part of the Beacon detect logs
The header section contains:
"_index": "engines_alerts-,
"_id": "-a9H1JMBe7Sz",
"_version": 1,
"_score": 0,
The detailed information is given in the table (Counters of the header part of logs).
2.1.11.2.2.2. The source part of the Beacon detect logs
The source part is defined by "_source" in the logs.
Note
`Extended document` screen on the Kibana interface.The example given here is a Kibana example.
"tls": {
  "client": {
    "server_name": "cisco-update.com"
  }
},
"@version": "1",
"event": {
  "created": "2024-09-09T13:02:34.254441+00:00",
  "end": "2024-09-09T11:52:25.666000+00:00",
  "severity": 3,
  "module": "beacon_detect",
  "start": "2024-09-09T11:47:44.012000+00:00",
  "category": [
    "network",
    "intrusion_detection"
  ],
  "kind": "alert",
  "id": "5e7bb104-6493-43b2-be4d-f7c28ce79e85",
  "dataset": "alert"
},
"source": {
  "ip": "10.0.0.60",
  "mac": "60:57:18:e9:4f:5d"
},
"beacon": {
  "mean_time_interval": 1,
  "active": true,
  "possible_cnc": "not_recognized",
  "session_count": 260,
  "type": "constant",
  "id": "c4c886b4ad",
  "hostname_resolution": "not_analyzed"
},
"destination": {
  "ip": "157.230.93.100",
  "port": 443
},
"observer": {
  "product": "gcenter",
  "uuid": "78f4fed1-c9ad-52b9-b509-6b87767f501f",
  "log_format_version": "1.0.0",
  "hostname": "gcenter-clelyo-01.gatewatcher.com",
  "gcap": {
    "hostname": "gcap-clement-l.gatewatcher.fr",
    "version": "2.5.4.0-rc1"
  },
  "version": "2.5.3.103",
  "vendor": "gatewatcher"
},
"ecs": {
  "version": "8.6.0"
},
"@timestamp": "2024-09-09T13:02:59.354490664Z",
"url": {
  "domain": "cisco-update.com"
},
"network": {
  "protocol": "tls",
  "timestamp": "2024-09-09T11:47:44.012000+00:00",
  "transport": "tcp"
}
2.1.11.2.2.3. List of counters of the Malcore alert
Note
The alert counters are visible:
In the
`Alert details`screen of the WebUIIn the
`Expanded document`screen of KibanaIn the export to the SIEM
The detailed information is given in the table (Counters of the source part of logs).
2.1.11.3. Management of the engine
2.1.11.3.1. Viewing the engine status
2.1.11.3.2. Engine update
2.1.11.3.3. Beacon detect configuration engine and management of the ignored destination list
The management interface is used:
To filter the events (engine inputs) either to activate protocols or to filter events:
see the screen description, see `Metadata rate limiter` screen
see the procedure, see Configuring Metadata Rate Limiters
To activate the engine or modify its parameters (sensitivity or Alerts rate limiter):
see the screen description, see `Beacon detect` screen (Beacon command)
see the procedure, see Setting up the beacon detect engine
To manage the
`Ignore list`used to explicitly filter healthy destinations (defined by domain name or IP):see the screen description, see `Beacon detect` screen (Beacon command)
see the procedure, see Setting up the beacon detect engine