2.1.10. Ransomware detect engine
2.1.10.1. Introduction
2.1.10.1.1. For what types of threats is this engine designed?
2.1.10.1.2. How does this particular engine detect threats?
2.1.10.1.3. How does Ransomware detect work in the GCenter?
The engine:
Retrieves events sent by the GCap (for further details, see the Detections / Predictions)
Analyzes these events (for further details, see the How does this particular engine detect threats?)
Generates alerts (for further details, see the Events generated)
2.1.10.1.3.1. Training and re-training
Note
During re-training, the engine continues to detect with previous learning.
2.1.10.1.3.2. Detections / Predictions
The first step uses the machine learning model to make unit predictions on samples
- The second step takes into account the contextual information of the SMB session in order to determine if it corresponds to a ransomwareIndeed, legitimate traffic is likely to occasionally (at least for a part of SMB sessions) have abnormal behaviour, and therefore raise unit alerts at the end of the first step. It is therefore necessary to have a second step to determine whether it is a ransomware.
Periodically, the following process is executed:
Step 1:
The engine tracks each SMB session and cut them in small 20-seconds time windows, that we will call "sample"
On each sample, features are built on READ and WRITE commands: for instance, READ/WRITE ratio or READ/WRITE sequences : many other features are employed
Based on these features, a prediction is made on each sample and produce an abnormality score
When multiple samples of the same SMB session are suspicious, and depending on the sensitivity level, an alert is produced
Step 2: for each SMB session with at least an abnormality score above the defined threshold, the following actions are performed:
- Analysis of ransomware behaviour shows that the number/share of abnormal samples in their SMB session is much larger than in legitimate traffic.Similarly, the observed anomaly scores are also generally much higher.
All this information is taken into account to raise or not a global alert on the corresponding SMB session.
Multiple sensitivity levels (5 levels. 5 corresponding to the highest sensitivity) corresponding to as many severity levels are associated with alerts.
In practice, the engine will potentially sequentially raise alerts for increasingly low sensitivities (and therefore significant severity) as the SMB session is analyzed.
2.1.10.2. Events generated
- In the main interface named WebUI of the GCenter in the
`Alerts`screenThe main interface named WebUI is described in Overview of the WEB UI.- To view the alerts, select the
`Ransomware`filter and view the list of alertsSee the presentation of the WebUI `Alerts` screen.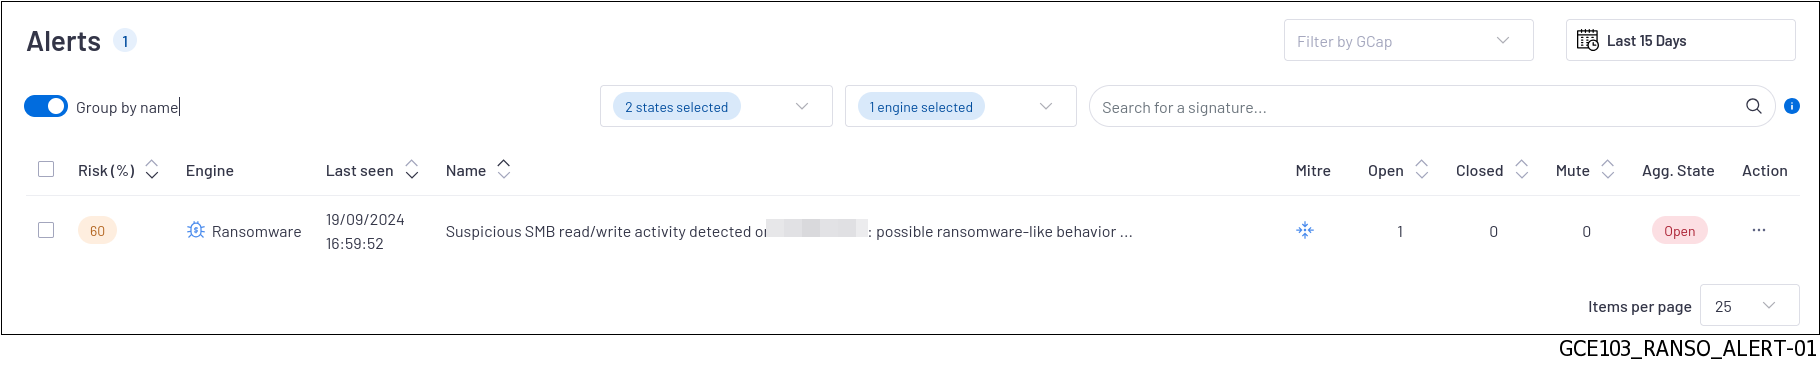
- Click on the selected alert.The
`Alert details`window is displayed.The detailed information of this alert is displayed in Example of Ransomware detect alert in the WebUI.
- In the interface named Kibana UI
- In the main interface WebUI, to view the alerts, select the
`Ransomware`engine filter.See the presentation of the WebUI `Alerts` screen. - After selecting the alert, click on the
`Open host SMB activity`command of the`Actions`menu.Kibana is opened on the`Ransomware`category of the`Alerts `section.The interface displayed is the interface named Kibana UI (described in the Overview of the Kibana GUI).In the`Overview`tab, the database is filtered on the`source.ip:`parameter. - Click on the toggle icon (1) on the left of the Alert.The expanded document (2) is displayed.
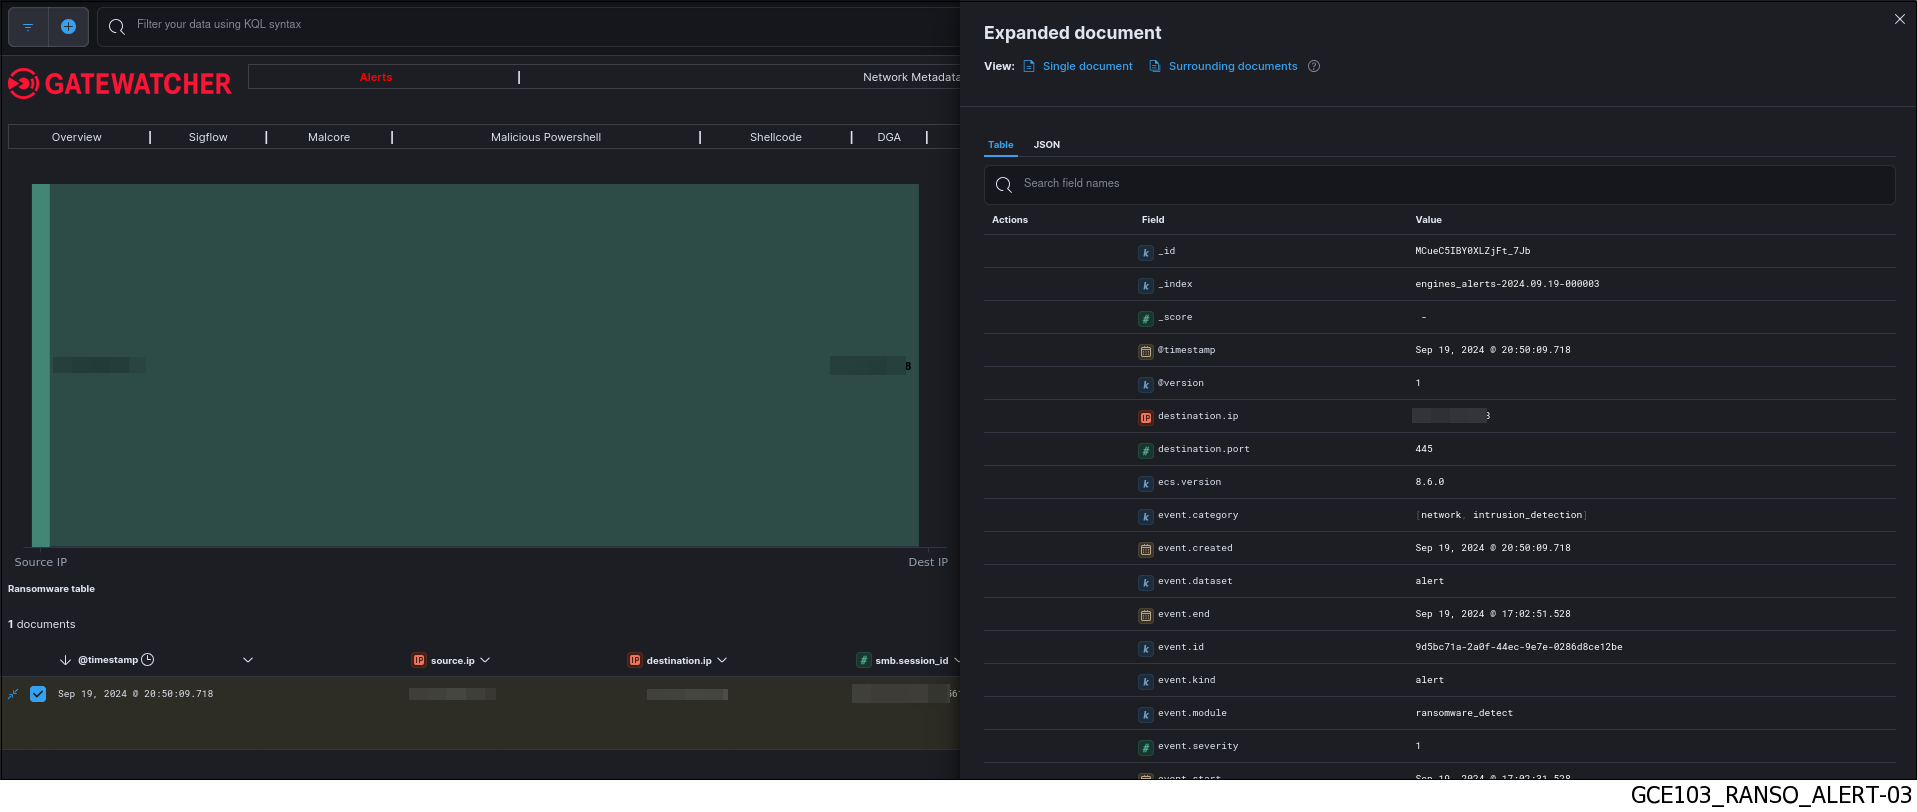 The detailed information of this alert can be viewed in table or json format (see the Ransomware detect log data structure).The displayed counters are given in the Engine log data structure appendix.
Note
The Kibana user interface is also accessible without a filter via the `Hunting` icon in the left menu bar.
2.1.10.2.1. Example of Ransomware detect alert in the WebUI

`Alert details` window is given in the `Alert details` window.2.1.10.2.2. Ransomware detect log data structure
The logs are composed of different parts:
The header part
The source part defined by "_source"
The field part defined by "_fields"
This information is displayed In the `Expanded document` screen of Kibana.
2.1.10.2.2.1. The header part of the Ransomware detect logs
The header section contains:
"_index": "engines_alerts-2024.12.17-000002",
"_id": "maMz2pMBPJntoSnXt_aZ",
"_version": 1,
"_score": 0,
The detailed information is given in the table (Counters of the header part of logs).
2.1.10.2.2.2. The source part of the logs
The source part defined by "_source" contains:
Note
`Extended document` screen on the Kibana interface.The example given here is a Kibana example.
"source": {
     "ip": "x.x.x.x",
     "port": 50066
   },
   "network": {
     "protocol": "smb",
     "transport": "tcp",
     "timestamp": "2024-12-18T14:34:54.069000+00:00",
     "community_id": "UNDEFINED",
     "flow_id": 2133648979435527
   },
   "@version": "1",
   "observer": {
     "log_format_version": "1.0.0",
     "hostname": "gcenter.gatewatcher.fr",
     "product": "gcenter",
     "uuid": "34b30bd0-ff0f-5fb2-a746-6500d47b45dd",
     "gcap": {
       "hostname": "gcap.gatewatcher.fr",
       "ingress": {
         "interface": {
           "name": "monvirt"
         }
       },
       "version": "2.5.4.0-rc9"
     },
     "version": "2.5.3.103",
     "vendor": "gatewatcher"
   },
   "event": {
     "kind": "alert",
     "created": "2024-12-18T14:37:08.775755+00:00",
     "end": "2024-12-18T14:35:20.642000",
     "dataset": "alert",
     "module": "ransomware_detect",
     "start": "2024-12-18T14:35:00.642000",
     "category": [
       "network",
       "intrusion_detection"
     ],
     "severity": 1,
     "id": "ce827e02-7eb6-4842-8863-b787f52d1104"
   },
   "destination": {
     "ip": "y.y.y.y",
     "port": 445
   },
   "ecs": {
     "version": "8.6.0"
   },
   "@timestamp": "2024-12-18T14:37:08.775Z",
   "smb": {
     "session_id": 593737889611873
   },
   "ransomware": {
     "alert_threshold": 930,
     "session_score": 35,
     "malicious_behavior_confidence": 80
2.1.10.2.2.3. List of counters of the alert
Note
The alert counters are visible:
In the
`Alert details`screen of the WebUIIn the
`Expanded document`screen of KibanaIn the export to the SIEM
The detailed information is given in the table (Counters of the source part of logs).
2.1.10.3. Management of the engine
2.1.10.3.1. Viewing the engine status
2.1.10.3.3. Ransomware detect configuration and management of the ignored list feature
The management interface is used:
To activate the engine or modify its parameters:
See the screen description, see `Ransomware detect` screen (Ransomware command).
See the Setting up the Ransomware detect engine procedure.
To manage the
`Ignore list`, list to explicitly filter healthy destinations (defined by IP):See the screen description, see `Ransomware detect` screen (Ransomware command).
See the Managing the Ignore list of the Beacon detect procedure.
Note
Even with metadata limiter enabled, ransomware detect will perform normally.