2.1.12. Yara engine
2.1.12.1. Introduction
2.1.12.1.1. For what types of threats is this engine designed?
The Yara engine allows detection of malware using rules.
2.1.12.1.2. How does this particular engine detect threats?
2.1.12.1.3. How does the Yara engine work in the GCenter?
The engine:
Retrieves events sent by the GCap (for further details see Yara engine input data)
Analyzes these events (for further details see How does this particular engine detect threats?)
Generates alerts (for further details see Events generated)
2.1.12.1.3.1. Yara engine input data
Note
For further information about the Yara rules, see information on https://yara.readthedocs.io/en/stable/writingrules.htmlTo validate the rules, it is possible to use the validator (https://yaravalidator.manalyzer.org/).To download an Yara ruleset example,yara_ruleset_example.yara.
2.1.12.2. Events generated
- In the main interface named WebUI of the GCenter in the
`Alerts`screen:The main interface named WebUI is described in Overview of the WEB UI.To filter the Yara alerts, type
`name:"Yara Rule Matched"`in the search field then validate.- Use the
`Group by name`selector to view the number of different alerts.The name of the aggregated alerts and their numbers are displayed.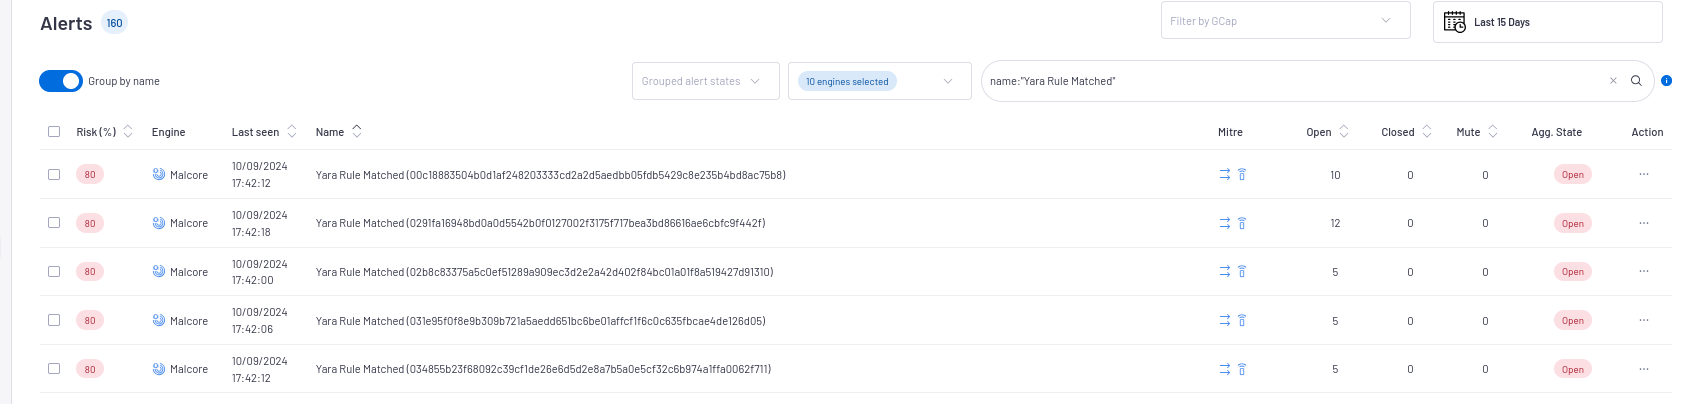
Click on a grouping of alerts to display the list, if needed.
- Disable the
`Group by name`selector.Different Source and Destination information is displayed for each alert.`Tags`and`Notes`are also visible and editable.The various Quick Access`Actions`are available for each alert. - Click on an alert.The detailed information of this alert is displayed in Example of an Yara alert in the WebUI.
- In the Kibana UI interface
To view all Yara alerts:
- In the main interface WebUI, click on the
`Hunting`icon.The main interface named WebUI is described in Overview of the WEB UI. Click on the
`Malcore`tab (2) of the`Alerts`category (1).Select the
`Overview`tab (3).- Select the time range (4) to display data.
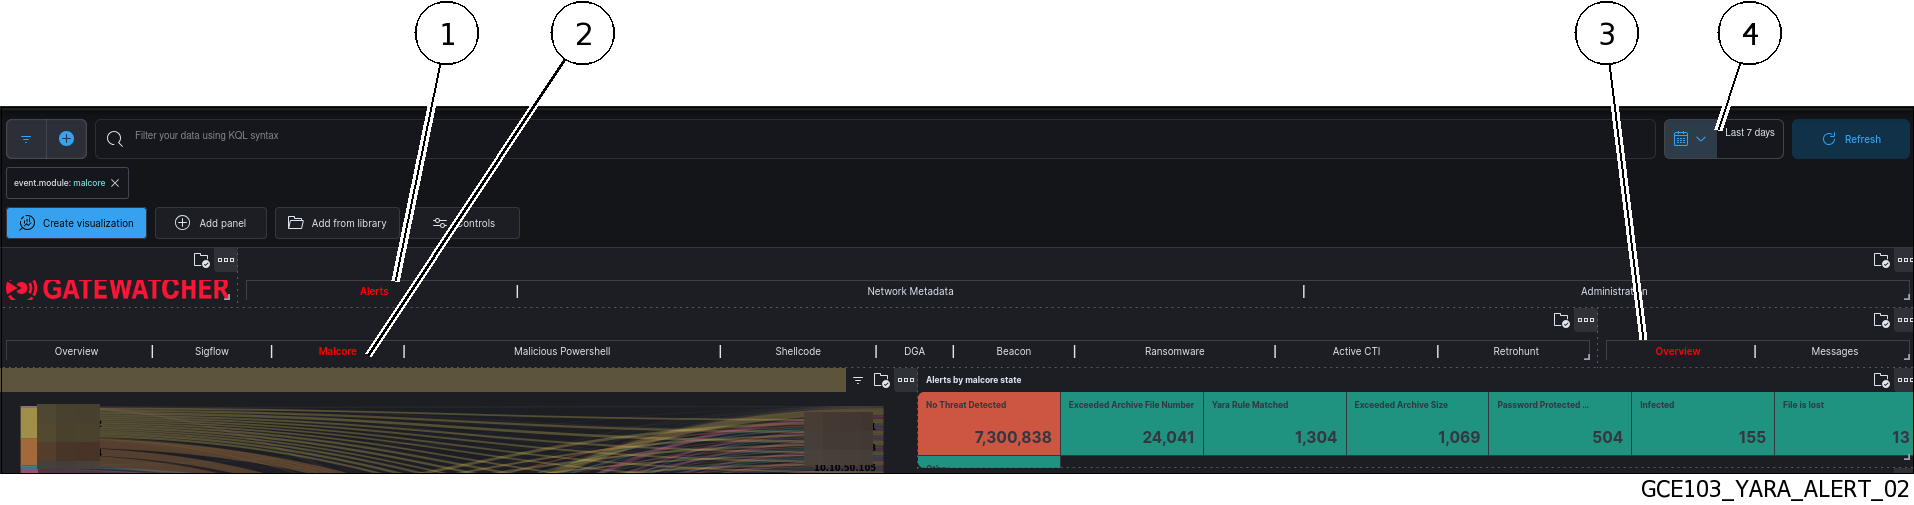 See the presentation of the WebUI `Alerts` screen.
 To filter the Yara alerts on Kibana, enter the following command
`event.module : "malcore" and malcore.state : "Yara Rule Matched"`(5) in the search field.Validate wih the
`Refresh`button (6).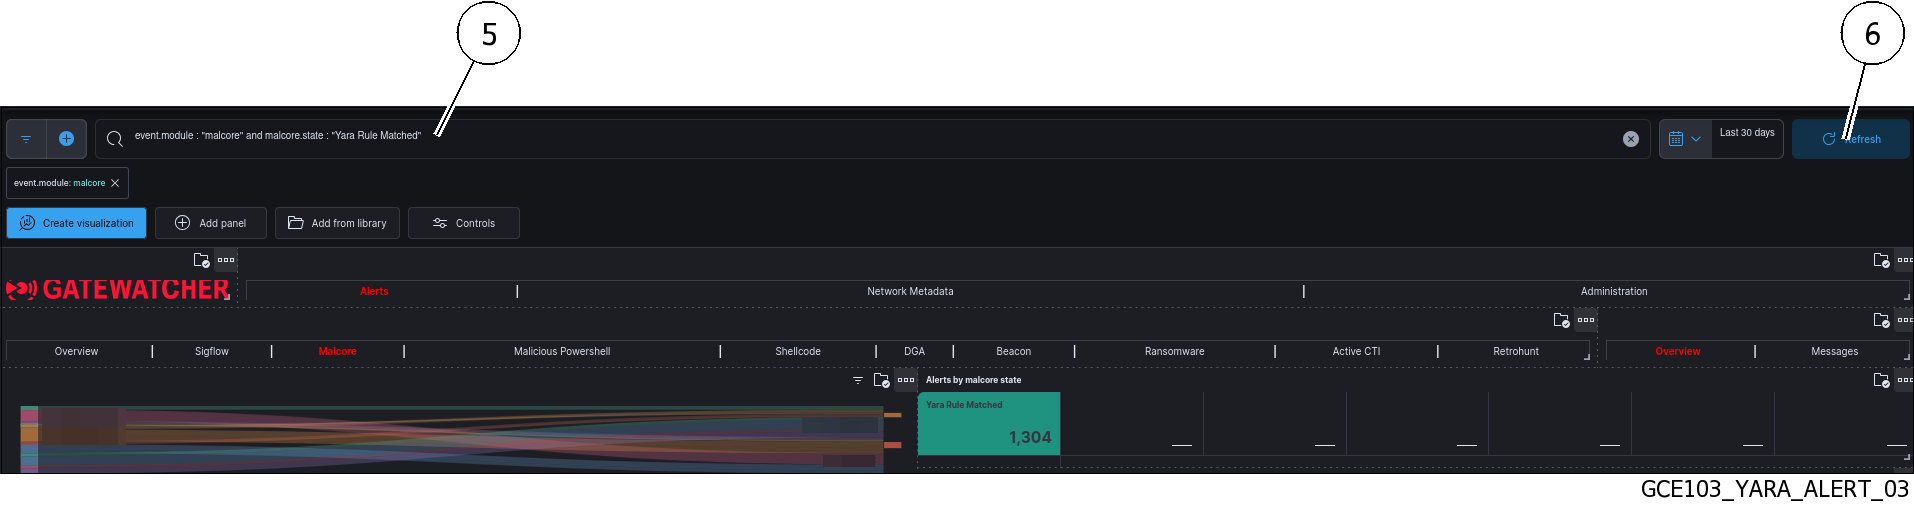
To consult information about a specific alert:
- After selecting the alert, click on the
`Open malcore file transaction`command of the`Actions`menu.Kibana is opened on the`Malcore`tab of the`Alerts `section: in the`Overview`tab, the database is filtered on the`file.hash.sha256`parameter (7).The interface displayed is the interface named Kibana UI (described in Overview of the Kibana GUI).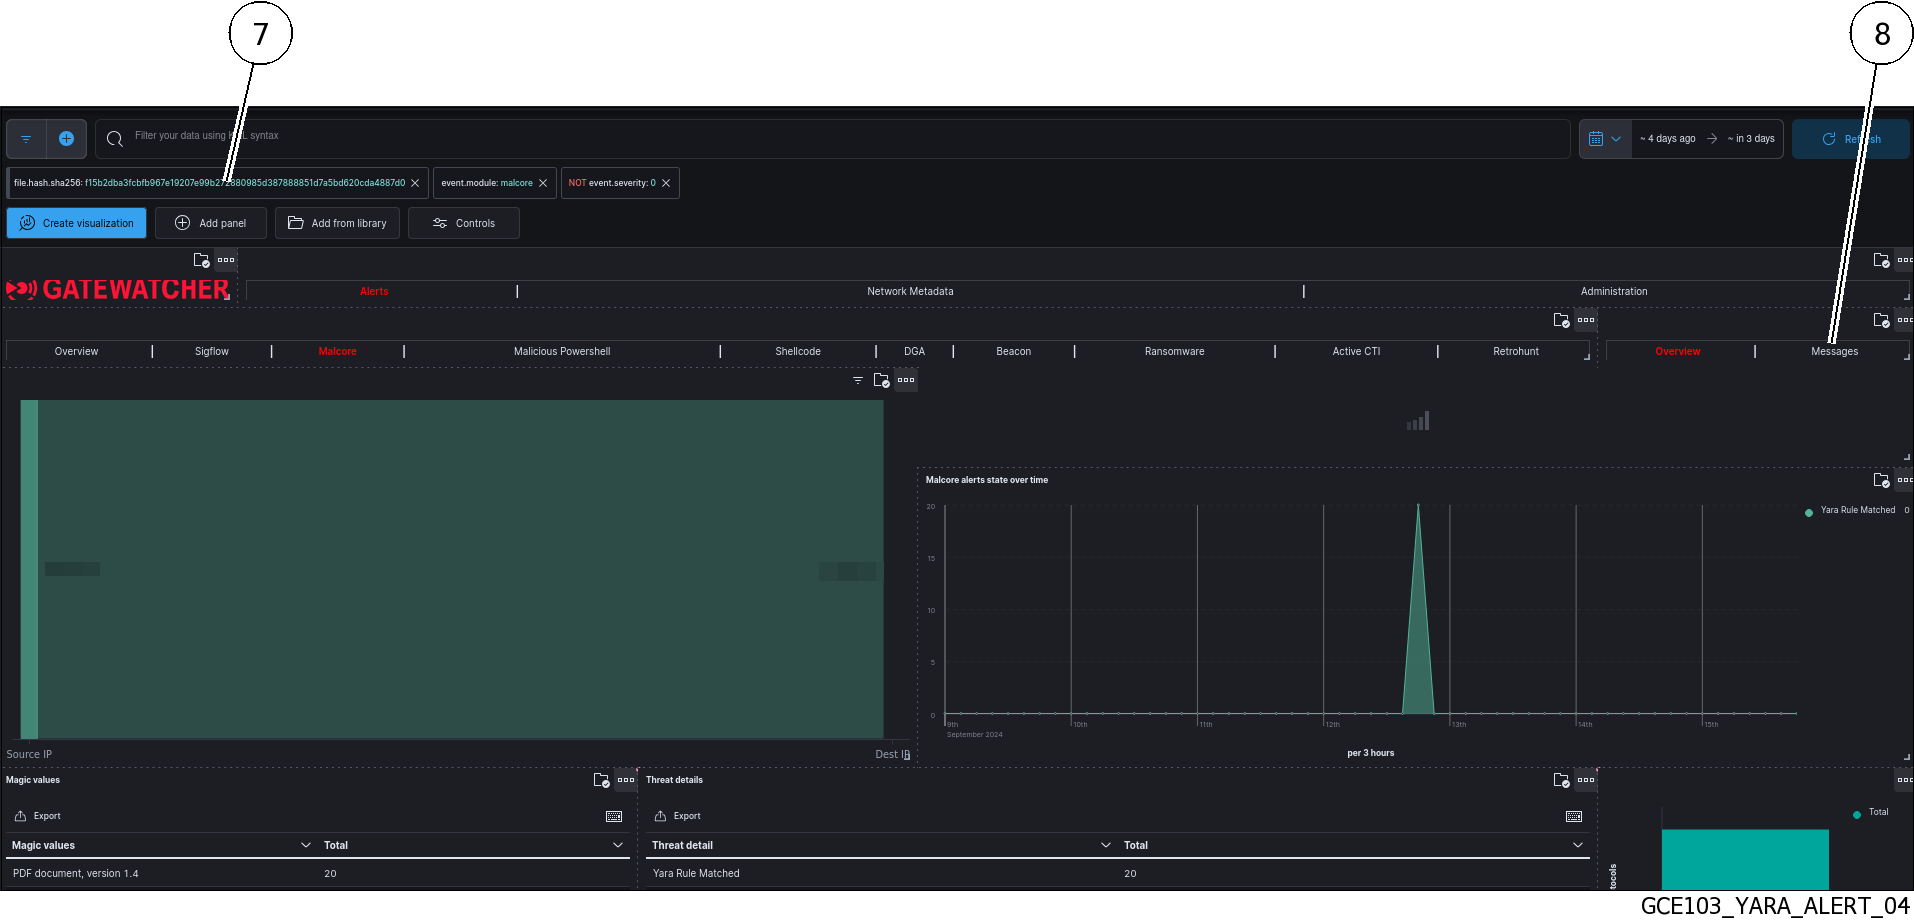
Click on the
`Messages`tab (8).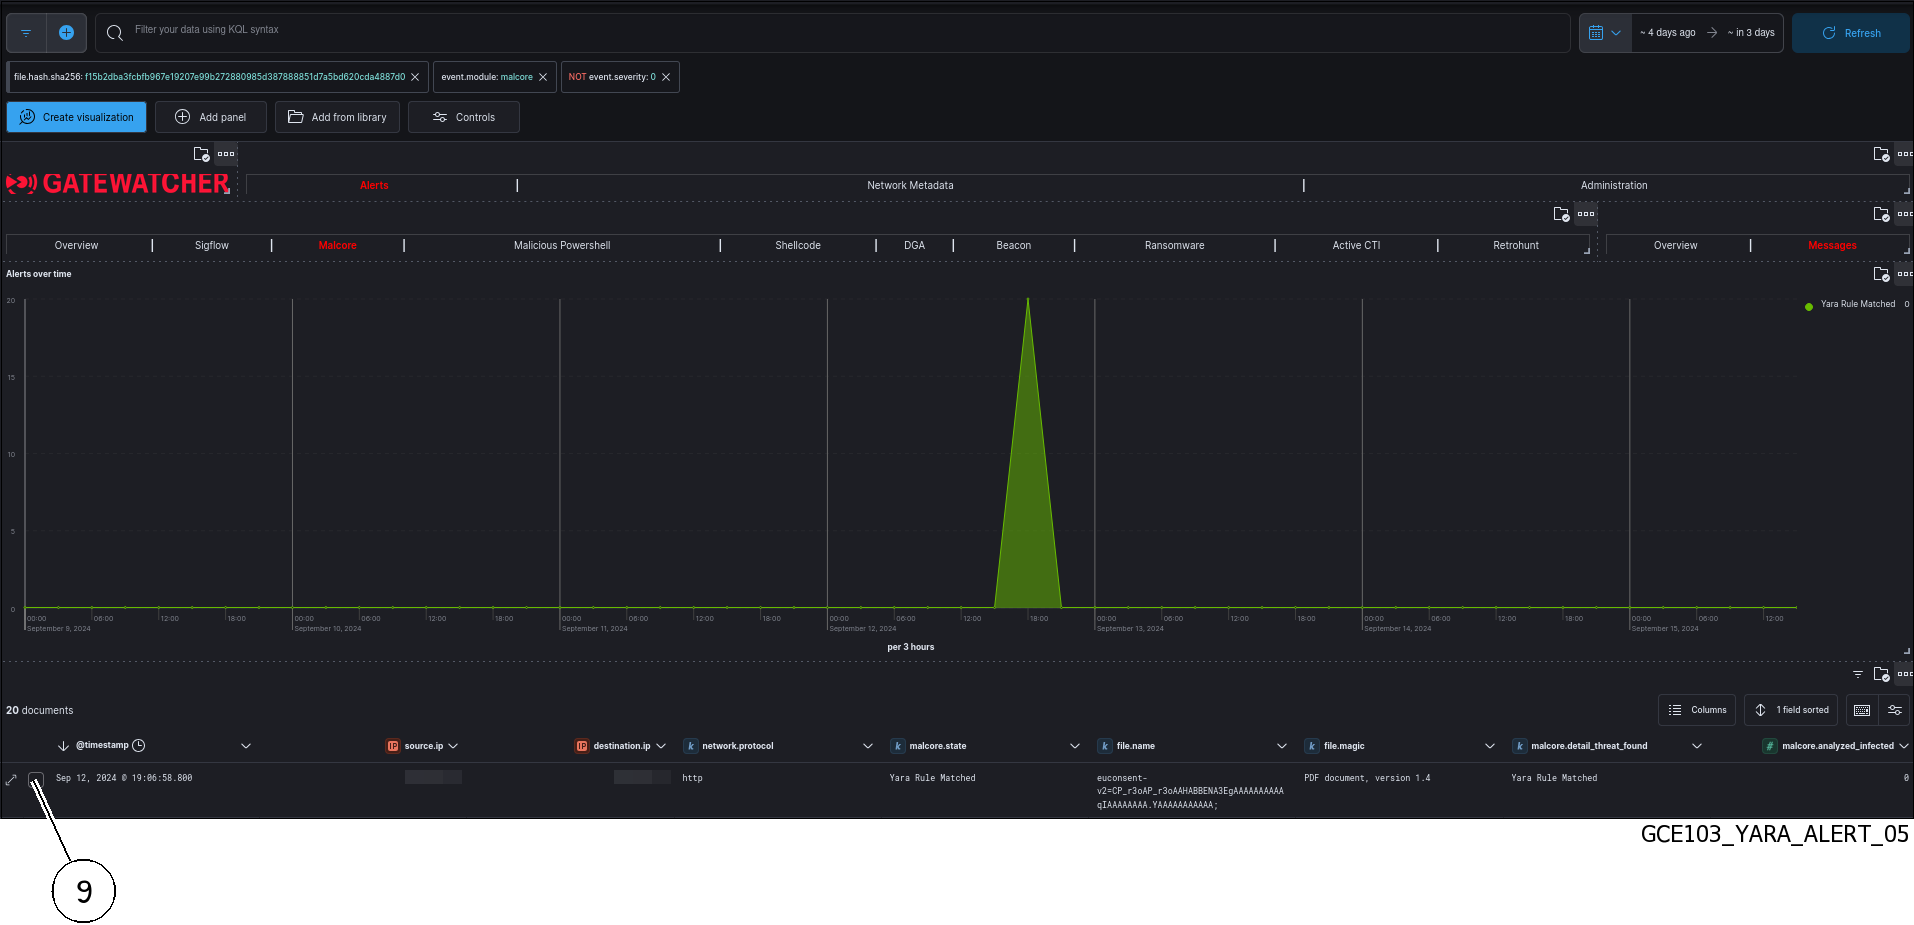
- Click on the toggle icon (9) on the left of the AlertThe expanded document is displayed.
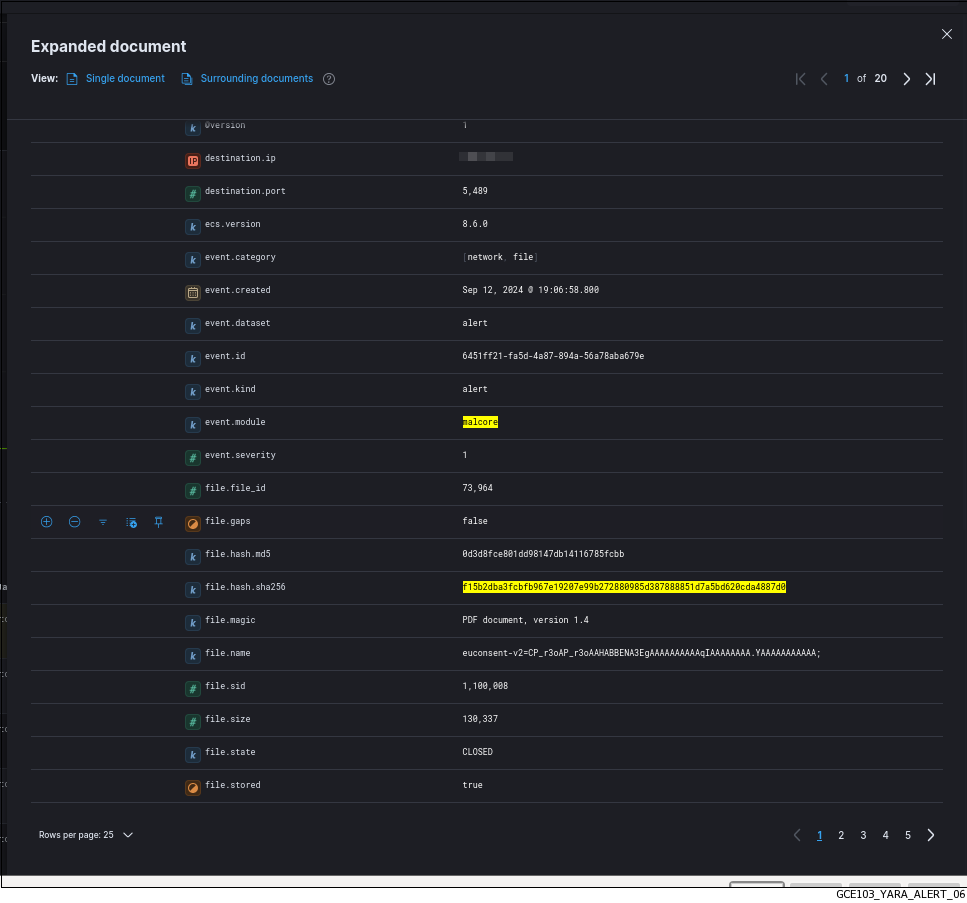 The detailed information of this alert can be viewed in table or json format (see the Yara log data structure).
An example is given in The source part of Yara logs.
2.1.12.2.1. Example of an Yara alert in the WebUI
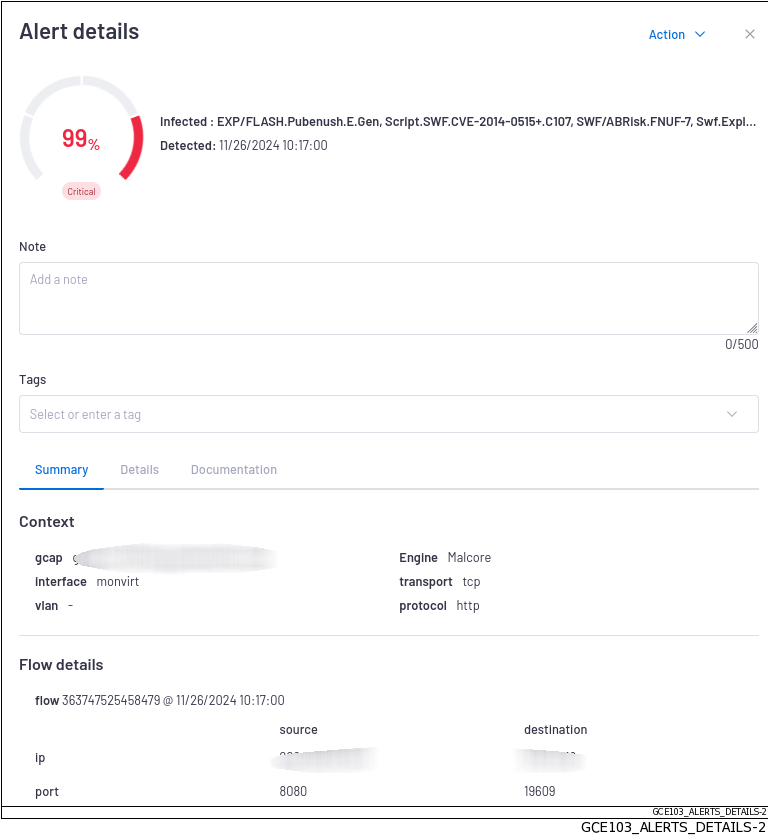
`Alert details` window is given in the `Alert details` window.2.1.12.2.2. Yara log data structure
The logs are composed of different parts:
The header part
The source part defined by "_source"
The field part defined by "_fields"
This information is displayed in the `Expanded document` screen of Kibana.
2.1.12.2.2.1. The header part of Yara logs
The header section contains:
"_index": "engines_alerts-2025.02.04-000001",
"_id": "odx80JQB3WGd7COqasTr",
"_version": 1,
"_score": 0,
The detailed information is given in the table (Counters of the header part of logs).
2.1.12.2.2.2. The source part of Yara logs
The source part is defined by "_source" in the logs.
Note
`Extended document` screen on the Kibana interface.The example given here is a Kibana example.
"@version": "1",
"source": {
  "ip": "192.168.122.15",
  "port": 53,
  "mac": "00:11:22:33:44:55"
},
"network": {
  "protocol": "dns",
  "tx_id": 193630,
  "flow_id": 2201432362562192,
  "transport": "udp",
  "timestamp": "2025-02-04T10:22:36.248783+0000"
},
"destination": {
  "ip": "8.8.8.8",
  "port": 53,
  "mac": "00:55:44:33:22:11"
},
"@timestamp": "2025-02-04T10:22:36.248Z",
"event": {
  "dataset": "alert",
  "created": "2025-02-04T10:22:36.248783+0000",
  "kind": "alert",
  "severity": 1,
  "module": "active_cti",
  "category": [
    "network",
    "intrusion_detection"
  ],
  "id": "d79bff72-01b6-4639-979c-efcb5e6faf23"
},
"sigflow": {
  "payload": "3+YBAAABAAAAAAAADjkyNzU4LWNvaW5iYXNlA2NvbQAAAQAB",
  "signature_id": 1300000773,
  "metadata": {
    "risk": [
      "highly suspicious"
    ],
    "signature_severity": [
      "2"
    ],
    "ioc": [
      "fffc7e75-cb75-4210-a244-669cba3cae06"
    ],
    "updated_at:": [
      "2025_02_04"
    ],
    "created_at:": [
      "2025_02_04"
    ]
  },
  "gid": 1,
  "action": "allowed",
  "rev": 0,
  "stream": 0,
  "payload_printable": ".............92758-coinbase.com.....",
  "signature": "Active CTI - Host - Unknown/Unknown - Unknown family - Unknown threat actor - fffc7e75-cb75-4210-a244-669cba3cae06",
  "category": "Active CTI"
},
"flow": {
  "bytes_toclient": 10843280,
  "pkts_toclient": 96815,
  "bytes_toserver": 7551648,
  "pkts_toserver": 96816,
  "start": "2025-02-04T10:20:39.242320+0000"
},
"ecs": {
  "version": "8.6.0"
},
"dns": {
  "query": [
    {
      "rrname": "92758-coinbase.com",
      "rrtype": "A",
      "tx_id": 193630,
      "opcode": 0,
      "type": "query",
      "id": 57318
    }
  ]
},
"observer": {
  "product": "gcenter",
  "vendor": "gatewatcher",
  "gcap": {
    "hostname": "gcap1000-s-2.mgmt.qa.gatewatcher.fr",
    "ingress": {
      "interface": {
        "name": "monvirt"
      }
    },
    "version": "2.5.4.0-rc9"
  },
  "hostname": "gcent9100r2.mgmt.qa.gatewatcher.fr",
  "uuid": "72cbafc7-7306-5382-96d2-203a730252a8",
  "version": "2.5.3.103",
  "log_format_version": "1.0.0"
}
2.1.12.2.2.3. List of counters of the alert
Note
The alert counters are visible:
In the
`Alert details`screen of the WebUIIn the
`Expanded document`screen of KibanaIn the export to the SIEM
The detailed information is given in the table (Counters of the source part of logs).
2.1.12.3. Management of the engine
2.1.12.3.3. Engine configuration
The management interface is used:
To active the engine
To load a Yara ruleset