2.1.3. Shellcode detect engine
2.1.3.1. Introduction
2.1.3.1.1. For what types of threats is this engine designed?
Not a file
It is directly executed in memory in a healthy program
Its small size reduces pattern possibilities for detection
May be obfuscated to avoid pattern detection
2.1.3.1.2. How does this particular engine detect threats?
Shellcode detection is done in several steps:
- The first step is to analyze the samples for shellcode encodings.Indeed, these algorithms are specific to shellcodes, they cannot be found in another context.This process allows accurate and indisputable identification of shellcodes.
If one or more encodings are identified, the shellcode is extracted and sent to the analysis step.
- If no encoding has been identified, the sample goes through a thorough indicator search.This process will perform an intelligent, emulation-based search to try to identify a typical shellcode behaviour.
- The last step is to analyze the identified shellcode in order to validate the detection, and extract as much information as possible.This process will perform full shellcode emulation and record all system functions called.
2.1.3.1.3. How does Shellcode Detect engine work in the GCenter?
The engine:
Retrieves events sent by the GCap (for further details see Shellcode Detect engine input data)
Analyzes these events (for further details see How does this particular engine detect threats?)
Generates alerts (for further details see Events generated)
2.1.3.1.3.1. Shellcode Detect engine input data
Note
2.1.3.2. Events generated
- In the main interface named WebUI on the GCenter in the
`Alerts`screenThe main interface named WebUI is described in the Overview of the WEB UI.- To display only these alerts, select the
`Shellcode`engine filter.See the presentation of the WebUI `Alerts` screen.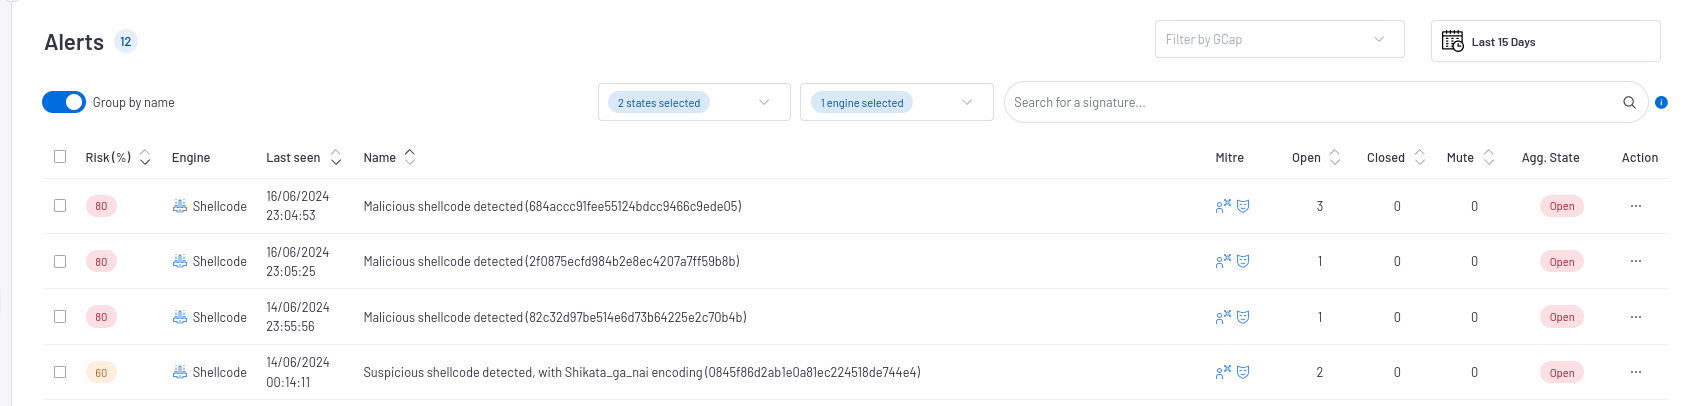
- Click on the selected alert.The
`Alert details`window is displayed.The detailed information of this alert is displayed in Example of a Shellcode alert in the WebUI.The displayed counters are given in the Engine log data structure appendix.
- In the interface named Kibana UI
- Click on the
`Hunting`icon of the`WebUI`.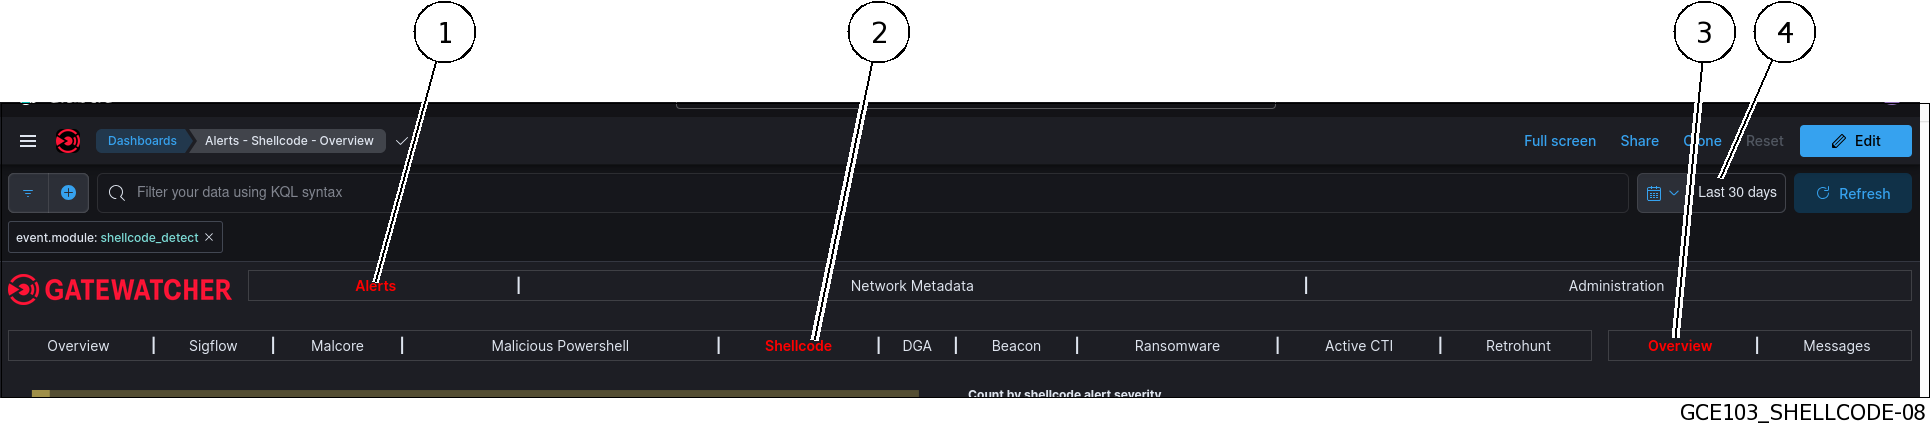 The interface displayed is the interface named Kibana UI (described in Overview of the Kibana GUI).
 Click on the
`Shellcode`tab (2) of the`Alerts`category (1).Select the
`Overview`tab (3).- Select the time range (4) to display data.It is then possible to filter on certain values for, for example:
Do not display healthy machines (filter false positives)
Show only alerts from a particular IP
Do not display alerts from a specific GCap
To consult information about a specific alert:
- Click on the toggle icon (1) on the left of the Alert.The expanded document (2) is displayed.
 The detailed information of this alert can be viewed in table or json format (see the Shellcode log data structure).The displayed counters are given in the Engine log data structure appendix.
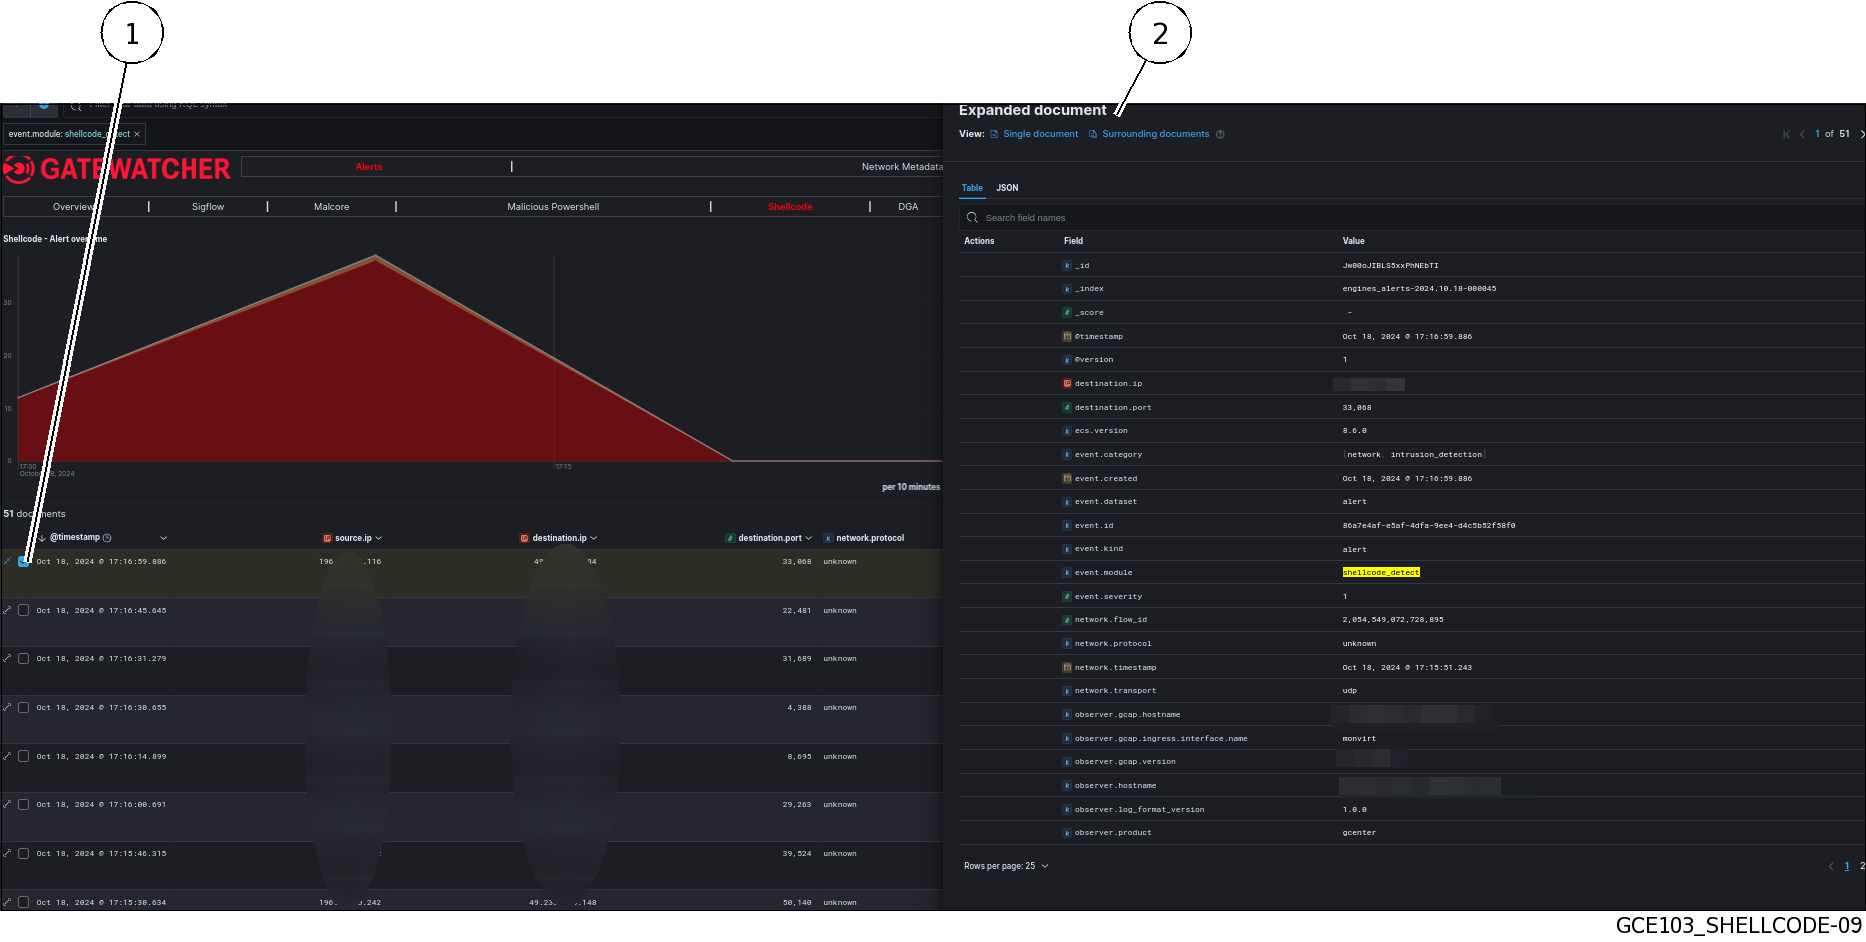
2.1.3.2.1. Example of a Shellcode alert in the WebUI
`Alert details` window is given in the `Alert details` window.2.1.3.2.2. Shellcode log data structure
The logs are composed of different parts:
The header part
The source part defined by "_source"
The field part defined by "_fields"
This information is displayed In the `Expanded document` screen of Kibana.
2.1.3.2.2.1. The header part of the Shellcode logs
The header section contains:
"_index": "engines_alerts-2024.12.04-000030",
"_id": "BqIIkpMBe7GX5B2fdvZJ",
"_version": 1,
"_score": 0,
The detailed information is given in the table (Counters of the header part of logs).
2.1.3.2.2.2. The source part of the Shellcode logs
The source part defined by "_source" contains:
Note
`Extended document` screen on the Kibana interface.The example given here is a Kibana example.
"event": {
  "created": "2024-12-04T14:17:28.138941+0000",
  "dataset": "alert",
  "severity": 1,
  "module": "shellcode_detect",
  "kind": "alert",
  "category": [
    "network",
    "intrusion_detection"
  ],
  "id": "f22d2438-d436-4391-9e7d-3fe1321ebed0"
},
"@version": "1",
"destination": {
  "port": 9999,
  "ip": "X.Y.Z.A"
},
"source": {
  "port": 33390,
  "ip": "W.S.Q.E"
},
"observer": {
  "log_format_version": "1.0.0",
  "hostname": "gcenter.domain.local",
  "vendor": "gatewatcher",
  "gcap": {
    "ingress": {
      "interface": {
        "name": "monvirt"
      }
    },
    "hostname": "gcap.gatewatcher.com",
    "version": "2.5.4.0"
  },
  "product": "gcenter",
  "uuid": "fc1e66e3-a397-5eb4-9277-754be778f317",
  "version": "2.5.3.103"
},
"ecs": {
  "version": "8.6.0"
},
"shellcode": {
  "sample_id": "12-04-2024T14:17:25_92517a8550cf4130b23466244880c1c7_gcap-int-129-dag.gatewatcher.com",
  "analysis": [
    {
      "args": "{'pathname': '//etc/passwd', 'flags': 'O_WRONLY|O_APPEND', 'mode': 'None'}",
      "_id": 0,
      "call": "sys_open",
      "ret": "4"
    },
    {
      "args": "{'fd': '//etc/passwd (4)', 'buf': 'bob::0:0::/://bin/sh', 'count': 20}",
      "_id": 1,
      "call": "sys_write",
      "ret": "20"
    },
    {
      "args": "{'fd': '//etc/passwd (4)'}",
      "_id": 2,
      "call": "sys_close",
      "ret": "0"
    },
    {
      "args": "{'status': 4}",
      "_id": 3,
      "call": "sys_exit",
      "ret": "0"
    },
    {
      "info": "Stop : End of shellcode (Exit)",
      "_id": -1
    }
  ],
  "sub_type": "Linux_x86_32",
  "encodings": [
    {
      "name": "Shikata_ga_nai",
      "count": 1
    }
  ],
  "id": "8ae5f9d35f3878cac3064fe93e4c311d"
},
"@timestamp": "2024-12-04T14:17:28.138Z",
"network": {
  "protocol": "unknown",
  "transport": "tcp",
  "timestamp": "2024-12-04T14:16:12.828909+0000",
  "flow_id": 1134126449059384
2.1.3.2.2.3. List of counters of the alert
Note
The alert counters are visible:
In the
`Alert details`screen of the WebUIIn the
`Expanded document`screen of KibanaIn the export to the SIEM
The detailed information is given in the table (Counters of the source part of logs).
2.1.3.3. Management of the engine
2.1.3.3.1. Viewing the engine status
The current engine status is displayed in the `Health checks` screen.
2.1.3.3.3. Engine configuration
See the description of the `Shellcode detect` screen (Shellcode command)
See the Setting up the Shellcode detect engine procedure.