2.1.5. Sigflow engine
2.1.5.1. Introduction
2.1.5.1.1. For what types of threats is this engine designed?
Detections of uncommon behaviour or unrecommended actions perform on the corporate network
Detections of suspicious/malicious actions perform on the corporate network such as malicious download, beaconing or file extraction
Detections based on automatic generated rules based on indices of compromissions (IOCs) originated from CTI
2.1.5.1.2. How does this particular engine detect threats?
2.1.5.1.3. How does Sigflow engine work in the GCenter?
Advanced configuration of the GCap parameters (including choice of protocols to monitor...)
A structured list of rules
Note
If the protocol monitored by rules is not selected then Sigflow will report these rules as incorrect and ignore them.
2.1.5.1.3.1. For more information
2.1.5.2. Detailed operation of the rules
2.1.5.2.1. Organizing the rules
The rules sent to the Sigflow engine are organized as follows:
A list of sources providing signature set files grouped in categories
A list of signatures capable of adapting to the needs of the environment to be monitored
A list of Ruleset enabling signatures to be linked to a GCap
Note
Managing the sources, categories, rules and rulesets is done in the rules manager built into the GCenter.
The following paragraphs describe the steps required to provide these rules in Ruleset form to the Sigflow module of the GCap through the GCenter:
- Management of available rule sources: see Sigflow engine signature sources paragraphSources are used to report repositories where signatures are made available.Once downloaded and unzipped, the rules must be added to the GCenter interface.These sources update automatically in the case of public source/HTTP if the GCenter is connected to the internet, otherwise, a manual update can be made at this interface in order to have the latest signatures of available.
- The creation of rulesets from the sources: see the Rulesets paragraphOnce the rules have been added, it is possible to directly assign this source to different rulesets
The generation of rulesets: refer to Generating rulesets
Applying rulesets to the GCap: refer to Detection Rulesets
Advanced configuration of the GCap parameters: refer to GCAP Profiles
2.1.5.2.2. Sigflow engine signature sources
Define and manage the sources of signatures for the detection engine
Manage the rule set files made available by the sources
Manage the categories and rules of these files
View the rules contained in the available sources
`Threat-DB update` fonction.2.1.5.2.3. Rulesets
2.1.5.2.3.1. Optimization of rulesets
2.1.5.2.3.2. Changing signatures
Activate signatures and categories
Deactivate signatures and categories
Modify the functioning of a signature in order to adapt it to the supervised information system by setting up a threshold or suppression of alert for a specific network.
Create a Suppress Rule on a rule: removes the raising of an alert according to a source or destination IP
Create a Threshold Rule: limit the number of alerts to be displayed based on a source or destination IP
Note
2.1.5.2.3.2.1. Definition of signatures
A signature is always made up of:
An action
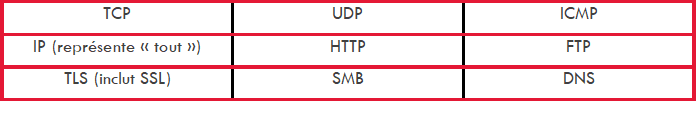
A protocol
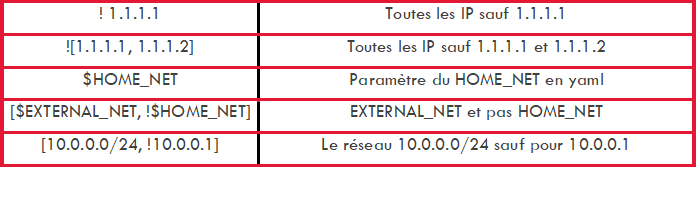
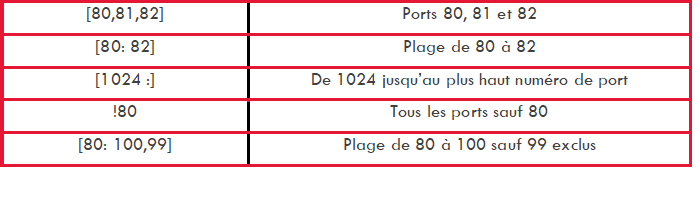
Network parameters such as IP and source and destination port
A message
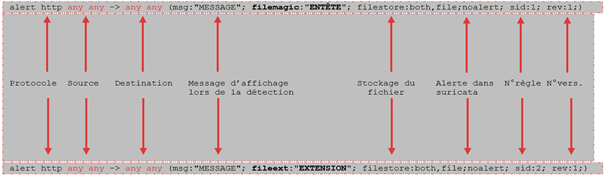
Example of a signature:

The following protocols may be subject to a rule:
This signature is composed of:
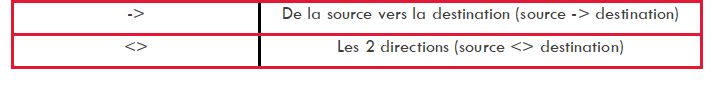
- The first part "action": corresponds to the action to be performed in case of detection.For example: "alert, pass, drop..."
- The 2nd part "the header": it is this part that allows to define the meaning of the alert as well as the networks and protocols.For example: "tcp any -> any "This part is composed of:
the "Direction" part: indicates the direction of the flow.
For its implementation, see the procedure Modifying Sigflow engine rules.
2.1.5.2.3.3. Removing or limiting the number of alerts
The number of alerts sent can be limited automatically or manually:
2.1.5.2.3.3.1. Manual creation of the deletion or limitation of the number of alerts
Syntaxe :
threshold: type <threshold|limit|both>, track <by_src|by_dst|by_rule|by_both>, count <N>, seconds <T>
The various fields are:
`type`field: defines the limitation type. There are three possibilities:
`limit`: limit alerts to no more than “N” times
`threshold`: minimum threshold for a rule before it generates an alert
`both`: limitation and threshold are applied
`track`field: defines the scope. There are several possibilities:
`by_src`: the limitation is applied to alerts with the same source IP address
`by_dst`: the limitation is applied to alerts with the same destination IP address
`by_rule`: the limitation is applied to all alerts triggered by the rule
`by_both`: the limitation is applied to alerts with the same IP pair source address + destination
`count`field: defines the quantity (limit or threshold) according to the type`seconds`field: defines the reference period
Example :
`threshold: type threshold, track by_src, count 10, seconds 60;
This rule only generates an alert after 10 raised alerts with the same source IP address within a period of one minute.
2.1.5.2.3.3.2. Automatic creation of limits on the number of alerts
Principle:
The number of alerts for one or more GCaps can be controlled by limitation
The GCenter counts alerts during an observation period and compares them to a programmable trigger point
The GCenter determines the rules that generated this threshold exceeding and based on the selected criterion (filter type), GCenter automatically creates alarm limits
These limits grouped by the GCap are communicated to the Sigflow engine present in each GCap to implement these limitations
There are several types of filtration:
`by_src`: the limitation is applied to alerts with the same source IP address
`by_dst`: the limitation is applied to alerts with the same destination IP address
`by_rule`: the limitation is applied to all alerts triggered by the rule
`by_both`: the limitation is applied to alerts with the same IP pair source address + destination
2.1.5.2.3.4. Generating rulesets
2.1.5.2.4. GCAP Profiles
From this configuration interface, users will be able to apply specific policy rules. They can customize the settings from the following categories:
2.1.5.2.4.1. Detection Rulesets
`Detection Rulesets` section enables the management of the network interfaces and defines the ruleset(s) used to inspect the captured traffic.Note
The `Detection Rulesets` section enables three configuration options:
Note
2.1.5.2.4.1.1. Single-tenant
2.1.5.2.4.1.2. Multi-tenant by interface
2.1.5.2.4.1.3. Multi-tenant by VLAN
The Multi-tenant by VLAN mode enables:
The assigning one ruleset per VLAN
The assigning a ruleset for the default VLAN for those VLANs not created via the interface
2.1.5.2.4.2. Base variables
The basic variables section is composed of:
2.1.5.2.4.2.1. Stream analysis and file extraction
2.1.5.2.4.2.2. HTTP Proxy
Note
XFF is a standard header enabling to identify the original IP address of a client connecting to a web server through an HTTP proxy or load balancer.
2.1.5.2.4.2.3. Payload
2.1.5.2.4.2.4. Community ID
Note
This field is present in solutions other than Gatewatcher. It can therefore enable correlating the different tools of the same information system.
The graphical interface and the details of the parameters are described in the `Community ID` zone.
2.1.5.2.4.2.5. Alerting and logging
This section enables configuring the alerting and logging of the protocols used by the GCap.
Note
If the GCap is one version ahead of the GCenter, it is possible that some protocols are not yet implemented in the latter.
This is discussed in more detail in the GCAP-documentation in the section Sigflow detection engine > Rebuilding files.
Terminology for alerting and logging:
alerting consists in activating the Sigflow signature detection for a given protocol. Indeed, if Sigflow is activated for a protocol then the stream that is identified by a signature will raise an alert on the GCenter side.
logging consists in enabling the generation of metadata for a given protocol. Indeed, if the latter is enabled for a protocol then each observed session will generate metadata for that protocol on the GCenter side.
Managing the configuration of the protocols is done:
By using default profiles such as Essential, Balanced, Deep, Paranoid and Performance.
By modifying the content of the profile uploaded to the GCap
2.1.5.2.4.3. Net variables
2.1.5.2.4.4. Flow timeouts
2.1.5.2.4.5. Files rules management
Time stamp
Source/destination IP address
Protocol
Source/destination port
Size
Md5sum, etc
Managing the configuration of the file extraction rules is done:
By using default profiles such as Essential, Balanced, Deep, Paranoid and Performance: in order from most to least complete
By modifying the content of the profile uploaded to the GCap
2.1.5.2.4.6. Packet filtering
`Packet filters` section enables specific traffic to be ignored directly at the GCap network card level.2.1.5.3. Events generated
The events generated by Sigflow are:
- Events of type "alert" when the engine has found a match with the signature defined in the alert rules.Events are displayed in the main GCenter interface as well as in Kibana.
- Events of type "fileinfo" when the Sigflow engine has reconstructed the network flow files`.These fileinfo events are only visible in the Kibana interface.
- Events of type "meta-data" when the Sigflow engine has recognized the network flow.These metadata events are only visible in the Kibana interface.
These events (or logs) are structured in the same way and this structure is presented in the Data structure of the Events of type "alert" paragraph.
2.1.5.3.1. Events of type "alert"
- In the main interface named WebUI on the GCenter in the
`Alerts`screenThe main interface named WebUI is described in Overview of the WEB UI.It is possible to view the found signature and its definition.- To view the alerts, select the
`Sigflow`engine filter.See the presentation of the WebUI `Alerts` screen.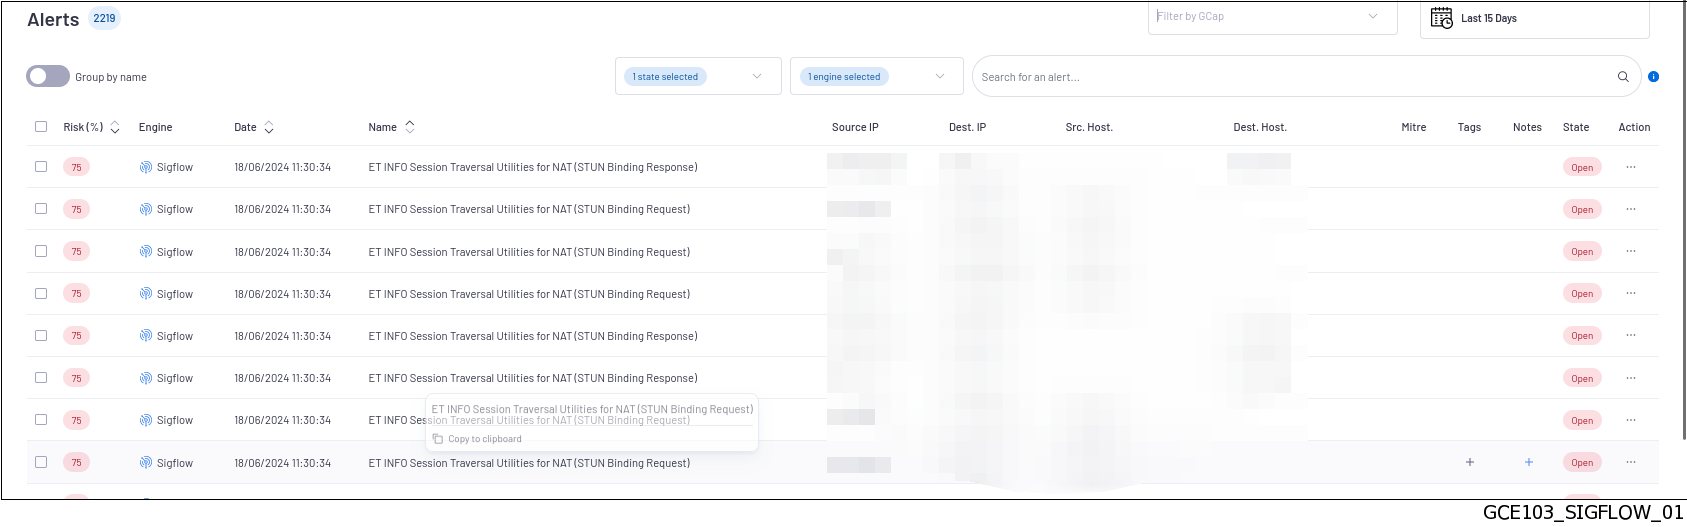
- Click on the selected alert.The
`Alert details`window is displayed.The detailed information of this alert is displayed: see Example of a Sigflow alert in the WebUI.The displayed counters are given in the Engine log data structure appendix.
- In the interface named Kibana UI
- In the main interface WebUI, to view the alerts, select the
`Sigflow`engine filter.The screen displays only the list of Sigflow alerts.
- After selecting the alert, click on the
`Open flow details`command of the`Actions`menu.See the presentation of the WebUI `Alerts` screen.Kibana is opened on the`Sigflow`category of the`Alerts `section.The interface displayed is the interface named Kibana UI (described in Overview of the Kibana GUI).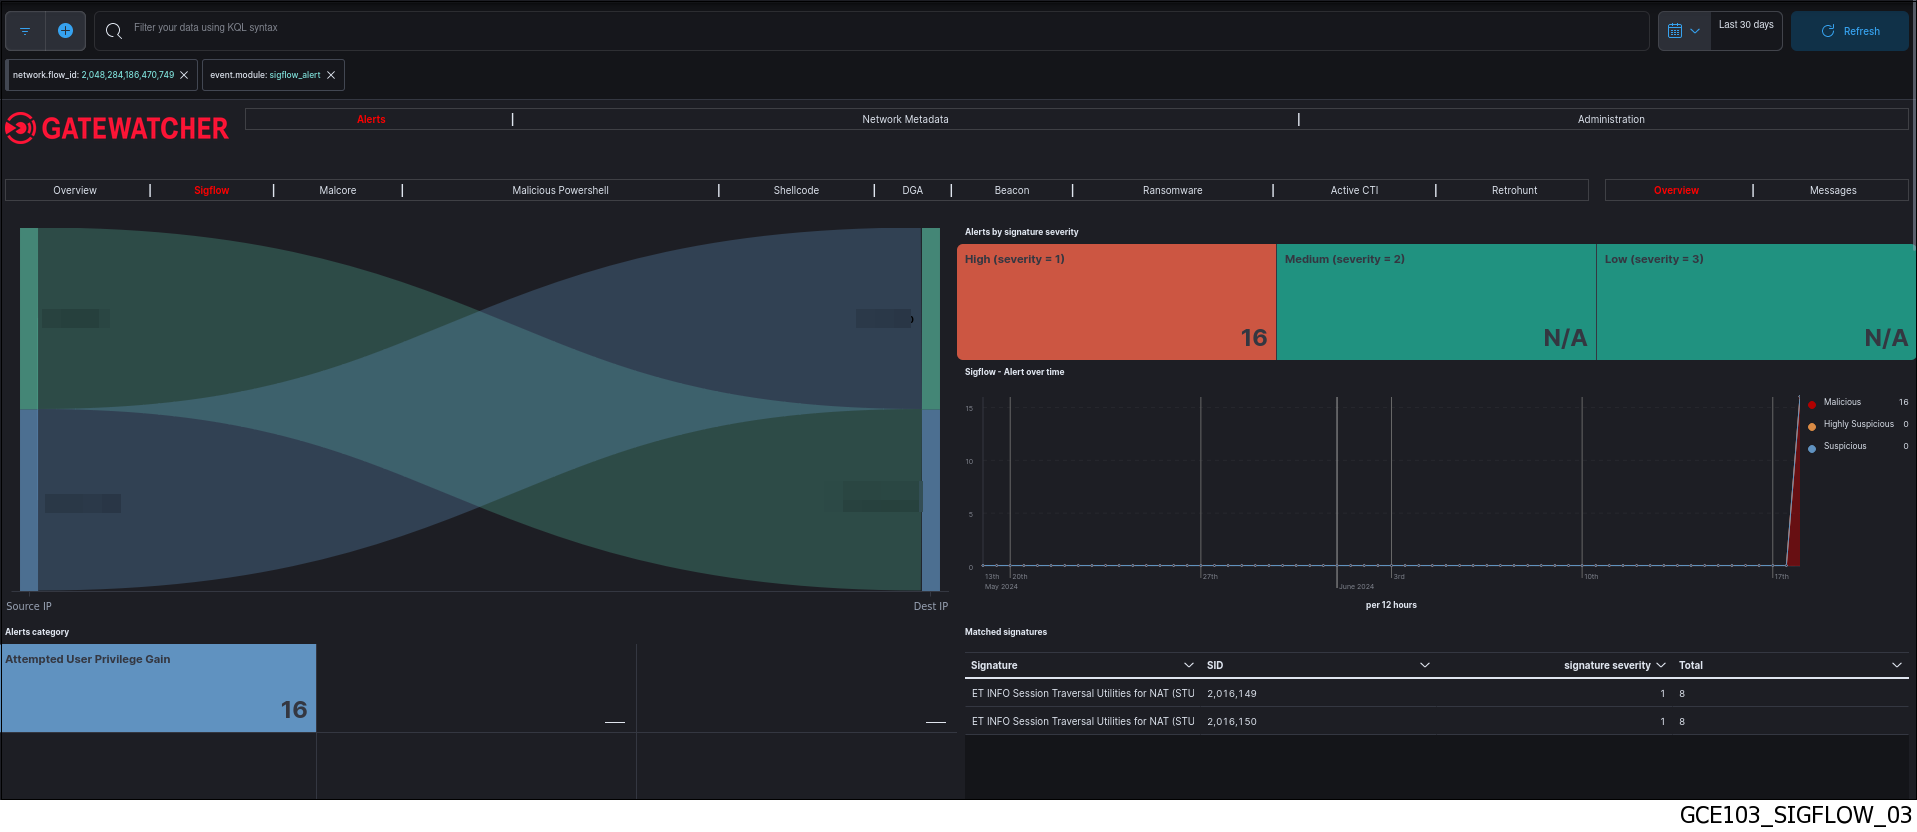
- Click on the
`Messages`tab (1).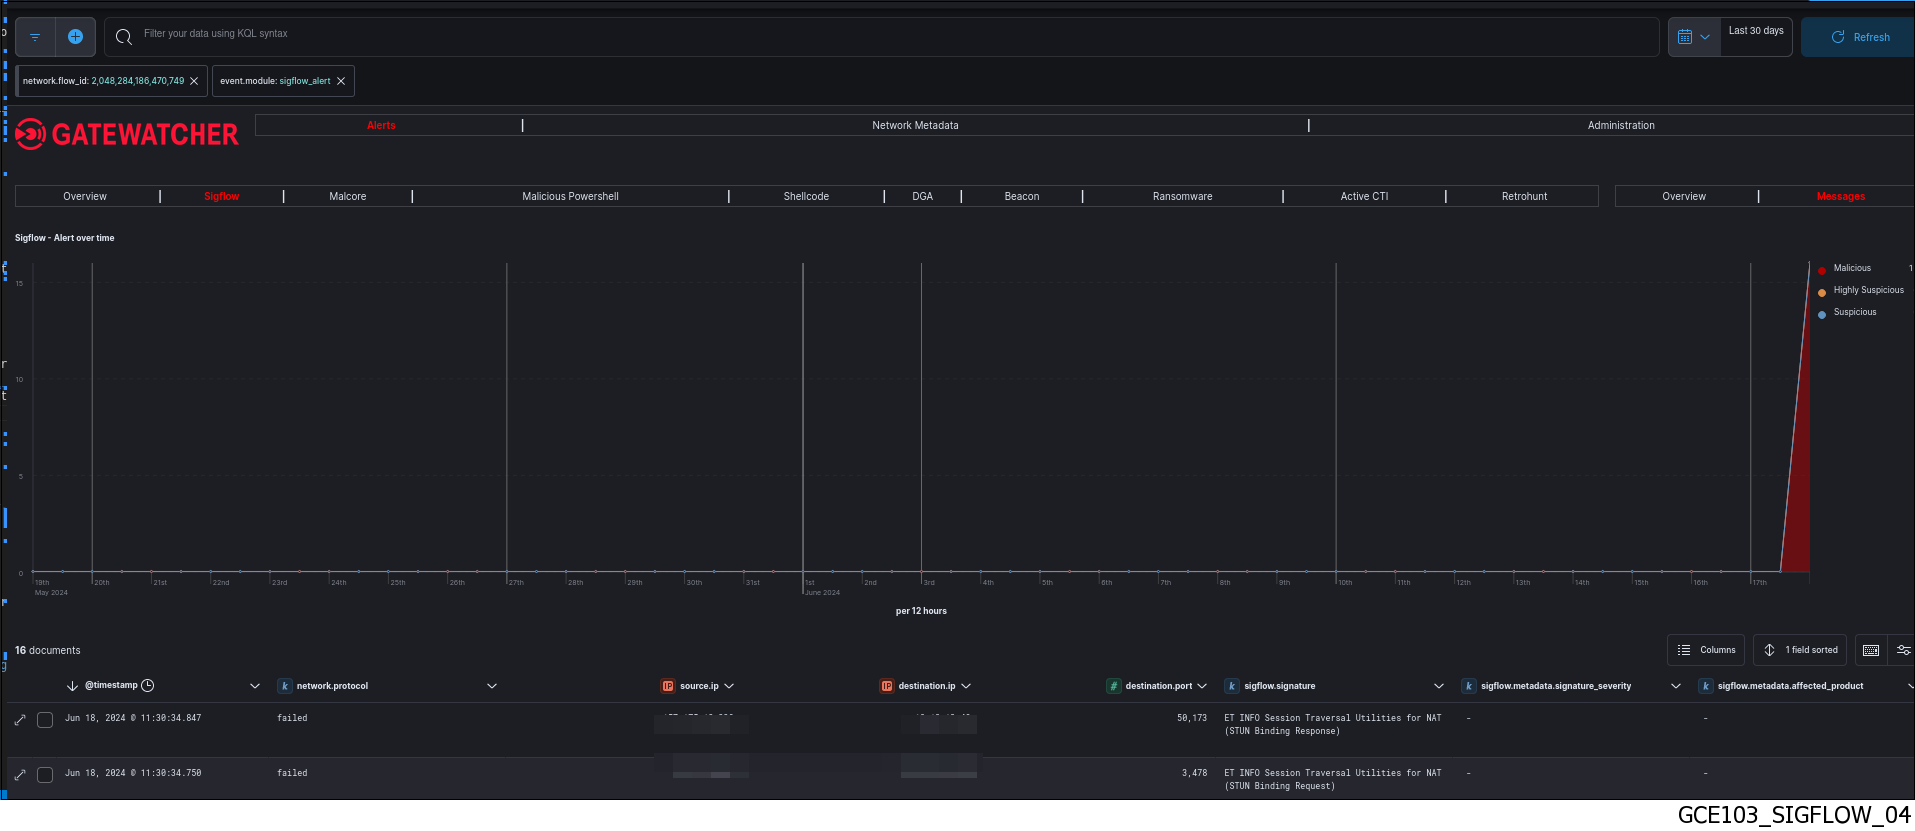 The Kibana database is filtered with the filters:
network.flow_id: unique ID of the flow selected
event.module: sigflow_alert
This page displays all alerts detected by Sigflow in this network flow (whatever the IP addresses or the direction). - Click on the toggle icon on the left of the alert (2).The
`Expanded document`window (3) is displayed.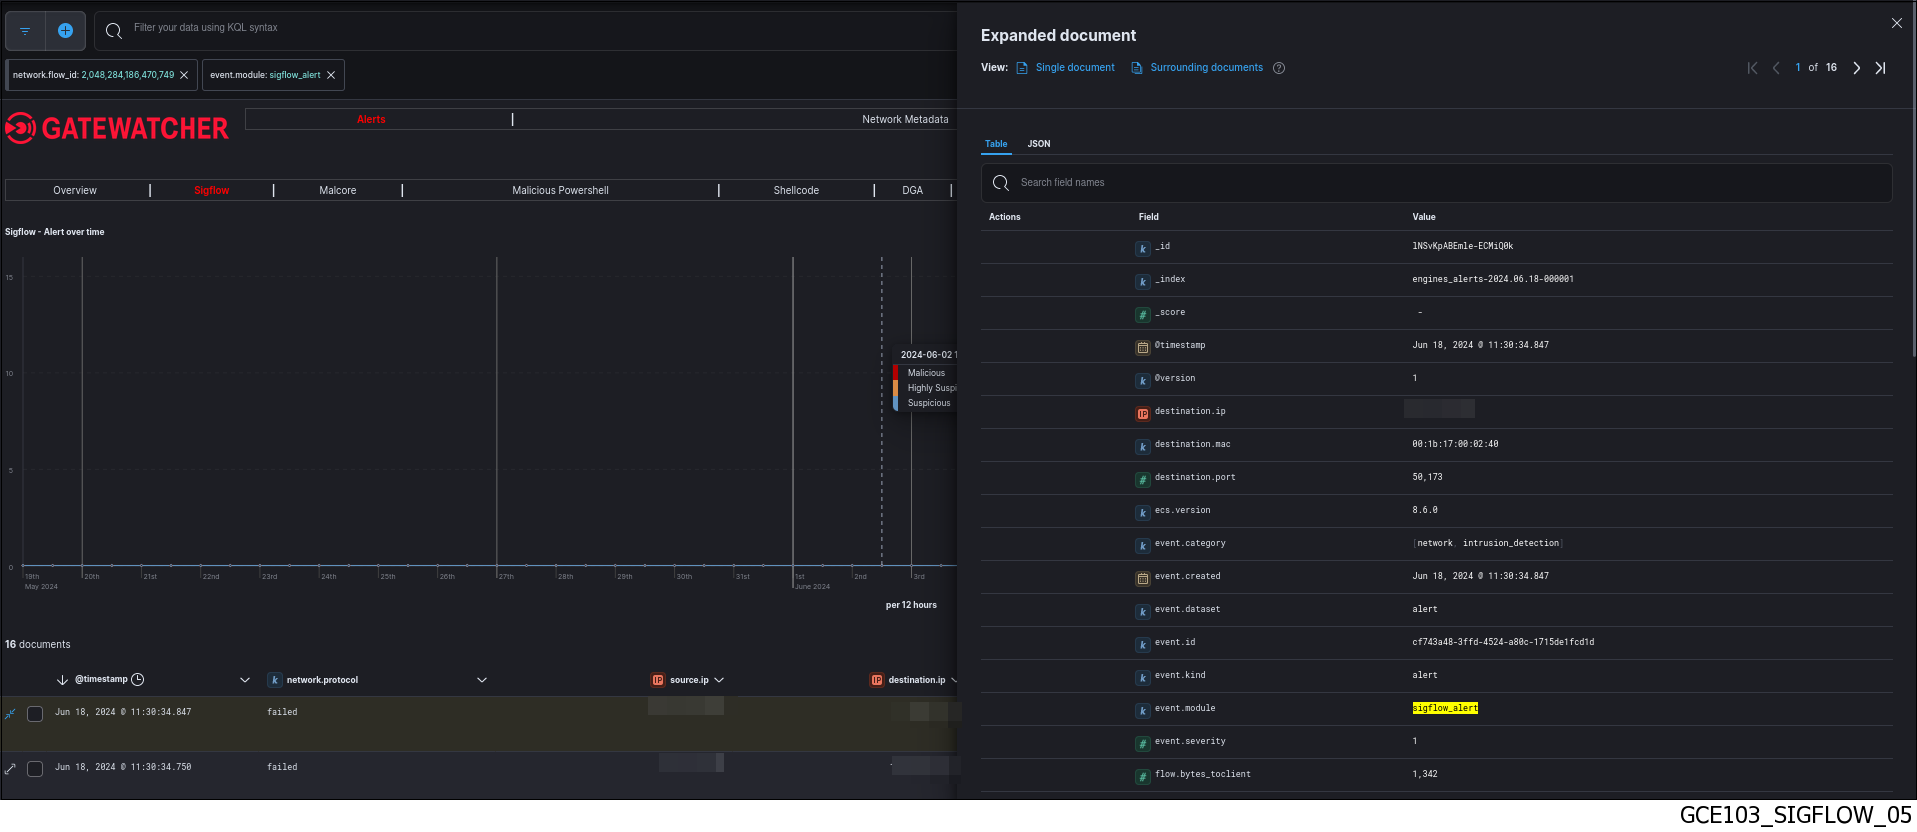 The detailed information of this alert can be viewed in table or json format (see the Events of type "alert").The displayed counters are given in the Engine log data structure appendix.
Note
The Kibana UI can also be accessed without any filters via the
`Hunting`icon on the left side menu bar in the WebUI.
2.1.5.3.1.1. Example of a Sigflow alert in the WebUI
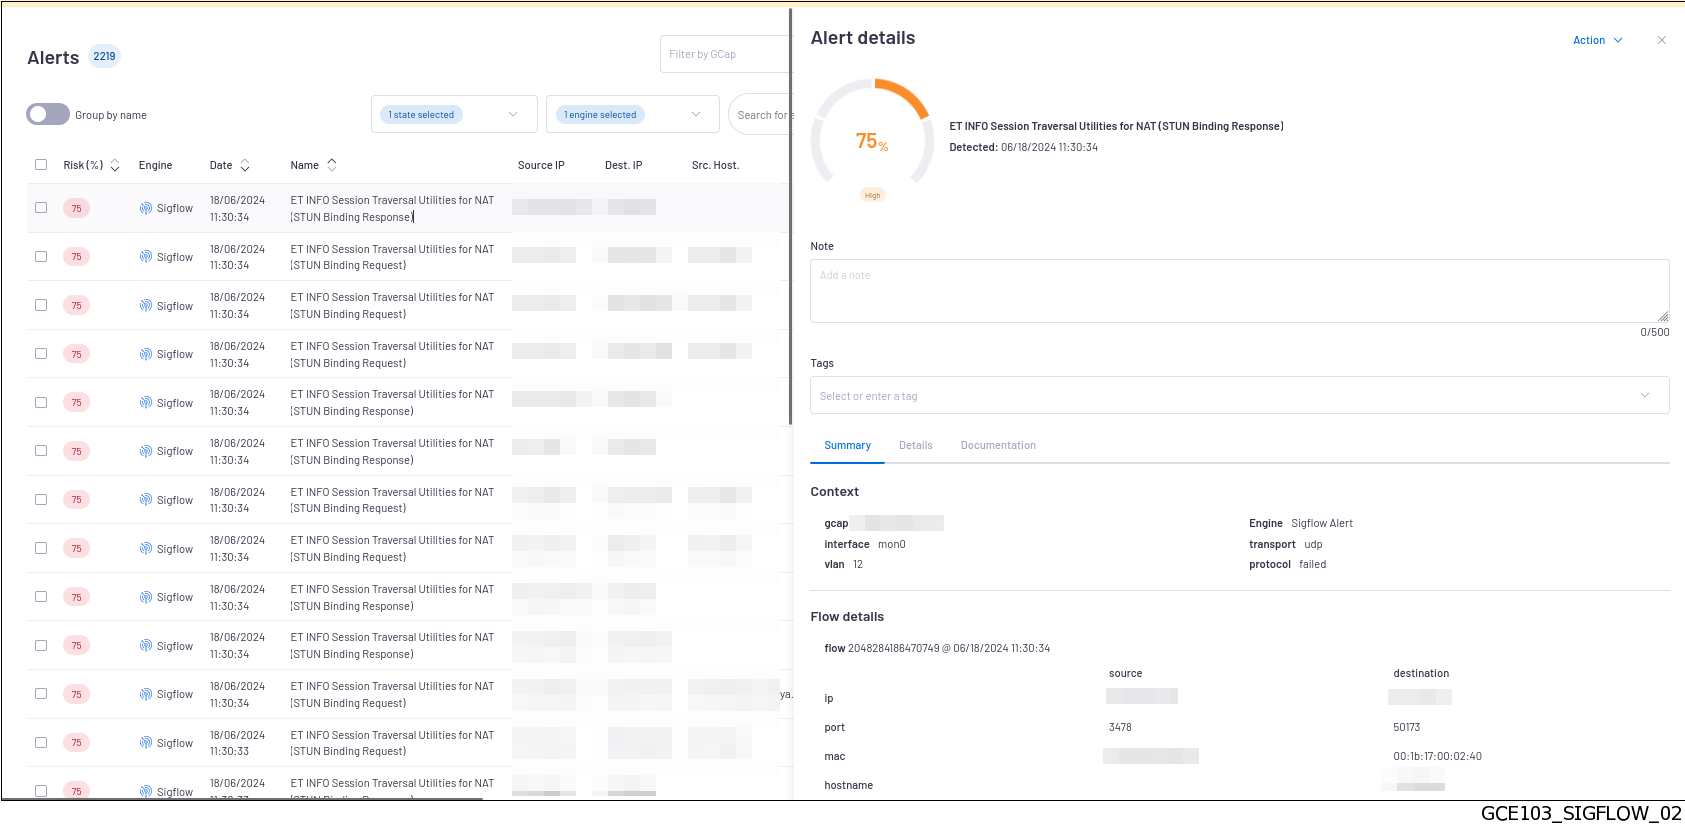
`Alert details` window is given in the `Alert details` window.2.1.5.3.1.2. List of protocols in the Events of type "alert"
app_proto_tc (to client)
app_proto_ts (to server)
app_proto_orig
Note
The protocol actually recognized by Sigflow is defined in the GCap profile in the `Alerting and logging` tab in the `Alerting` column.
2.1.5.3.1.3. Data structure of the Events of type "alert"
The logs are composed of different parts:
The header part
The source part defined by "_source"
The field part defined by "_fields"
This information is displayed in the `Expanded document` screen of Kibana.
2.1.5.3.1.3.1. The header part of the Events of type "alert"
The header section contains:
"_index": "engines_alerts-2024.11.26-000022",
"_id": "yZzDZ5MBe7GX5B2fDKfY",
"_version": 1,
"_score": 0,
The detailed information is given in the table (Counters of the header part of logs).
2.1.5.3.1.3.2. The source part of the Events of type "alert"
The source part defined by "_source" contains:
Note
`Extended document` screen on the Kibana interface.The example given here is a Kibana example.
 "http": {
   "response": {
     "status": 200,
     "bytes": 1197,
     "mime_type": "application/octet-stream"
   },
   "http_response_body": "TVqQAAMAAAAA//8AALgAAAOAADwELAQYAAAAAAAAAA",
   "http_response_body_printable": "MZ.....!..L.!This program cannot be run in DOS mode.\r\r\n$..............."
   "hostname": "",
   "version": "HTTP/1.1",
   "request": {
     "method": "GET"
   }
 },
 "source": {
   "ip": "",
   "port": 41710,
   "mac": ""
 },
 "flow": {
   "pkts_toserver": 4,
   "bytes_toserver": 338,
   "pkts_toclient": 12,
   "bytes_toclient": 15280,
   "start": "2024-11-26T09:16:56.277148+0000"
 },
 "observer": {
   "gcap": {
     "ingress": {
       "interface": {
         "name": "monvirt"
       }
     },
     "hostname": "gcap.gatewatcher.com",
     "version": "2.5.x"
   },
   "product": "gcenter",
   "hostname": "gcenter.domain.local",
   "version": "2.5.3.103",
   "log_format_version": "1.0.0",
   "uuid": "fc1e66e3-a397-5eb4-9277-754be778f317",
   "vendor": "gatewatcher"
 },
 "network": {
   "tx_id": 0,
   "protocol": "http",
   "timestamp": "2024-11-26T09:16:56.278736+0000",
   "transport": "tcp",
   "flow_id": 95140270586524
 },
 "ecs": {
   "version": "8.6.0"
 },
 "metadata": {
   "flowbits": [
     "min.gethttp",
     "exe.no.referer"
   ]
 },
 "destination": {
   "ip": "x.y.z.a",
   "port": 16122,
   "mac": "10:e2:ba:a6:a4:70"
 },
 "sigflow": {
   "action": "allowed",
   "payload_printable": "GET /emd.exe HTTP/1.1\r\nHost: opred.net\r\nConnection: Keep-Alive\r\n\r\n",
   "stream": 1,
   "packet": "kOK6pqSQkOK6pqSRmgk2FpoJNha",
   "packet_info": {
     "linktype": 1
   },
   "signature_id": 2019714,
   "metadata": {
     "updated_at": [
       "2024_04_22"
     ],
     "performance_impact": [
       "Significant"
     ],
     "created_at": [
       "2014_11_15"
     ]
   },
   "gid": 1,
   "signature": "ET CURRENT_EVENTS Terse alphanumeric executable downloader high likelihood of being hostile",
   "payload": "R0VUIC9lbWQuZXhlIEhUVFAvMS4mUNCg0K",
   "category": "Potentially Bad Traffic",
   "rev": 11
 },
 "url": {
   "domain": "opred.net",
   "path": "/emd.exe"
 },
 "@timestamp": "2024-11-26T09:16:56.278Z",
 "event": {
   "created": "2024-11-26T09:16:56.278736+0000",
   "dataset": "alert",
   "module": "sigflow_alert",
   "kind": "alert",
   "category": [
     "network",
     "intrusion_detection"
   ],
   "severity": 2,
   "id": "ce95f31d-6bb1-45f9-9f06-1661f5431329"
 },
 "@version": "1"
}
2.1.5.3.1.3.3. List of counters of the Events of type "alert"
Note
The alert counters are visible:
In the
`Alert details`screen of the WebUIIn the
`Expanded document`screen of KibanaIn the export to the SIEM
The detailed information is given in the table (Counters of the source part of logs).
2.1.5.3.2. Events of type "fileinfo"
- Click on the
`Hunting`icon of the`WebUI`.
Click on the
`Network Metadata`section (2) then the`File Transactions`category (1).- Click on the
`Messages`tab (3).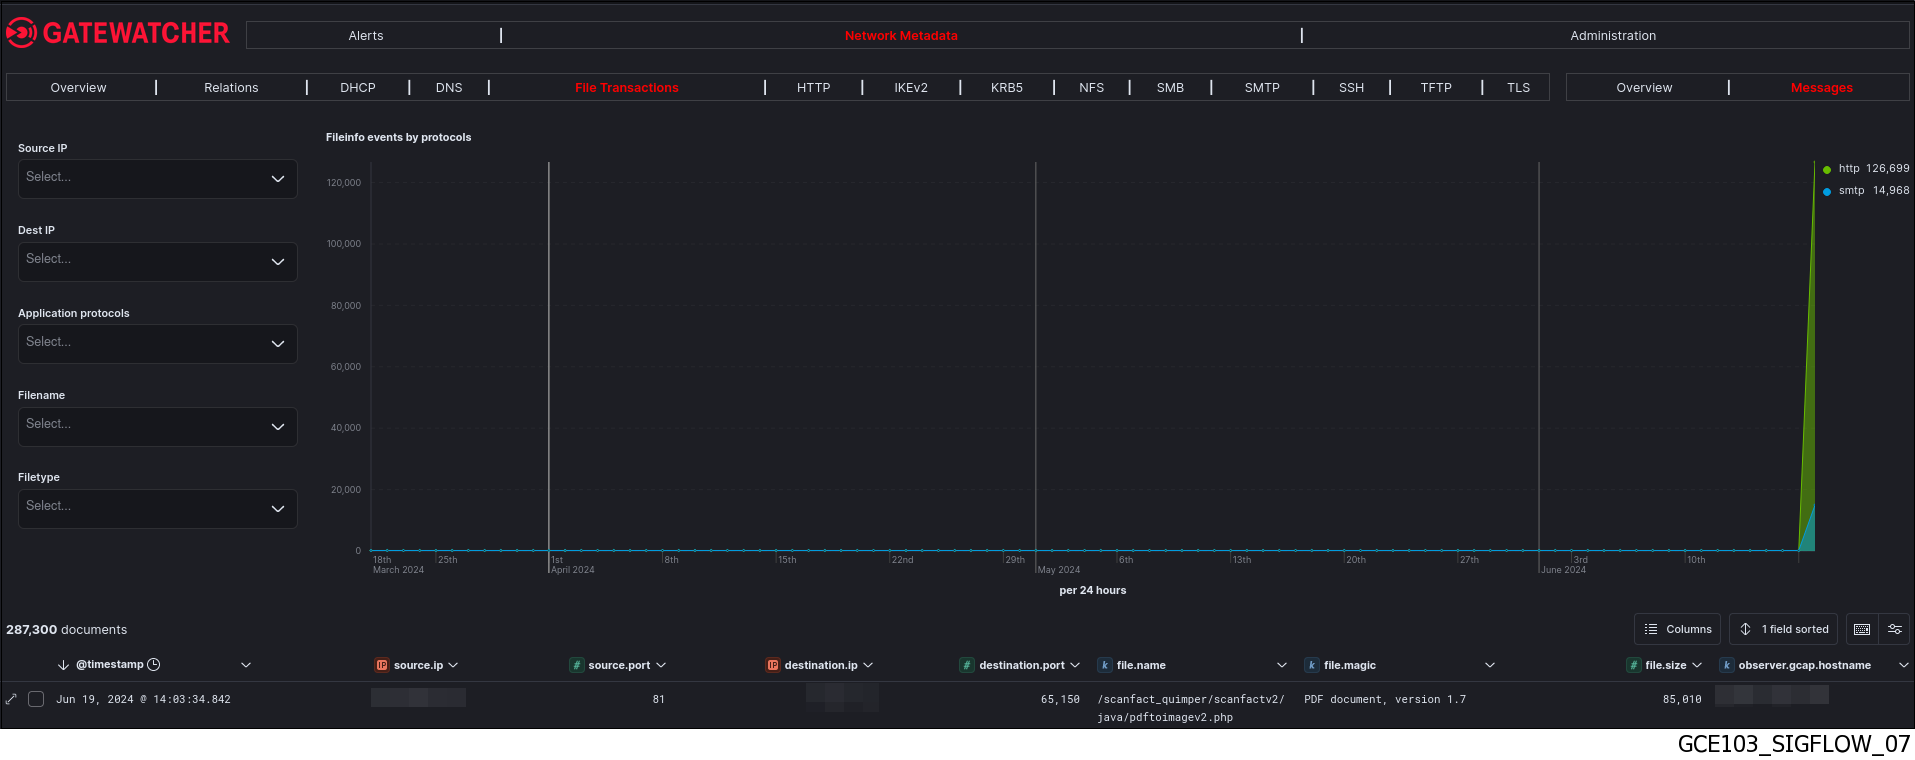 This page displays all events of fileinfo type corresponding to the reconstructed files in this network flow.
- Click on the toggle icon on the left of the alert (1).
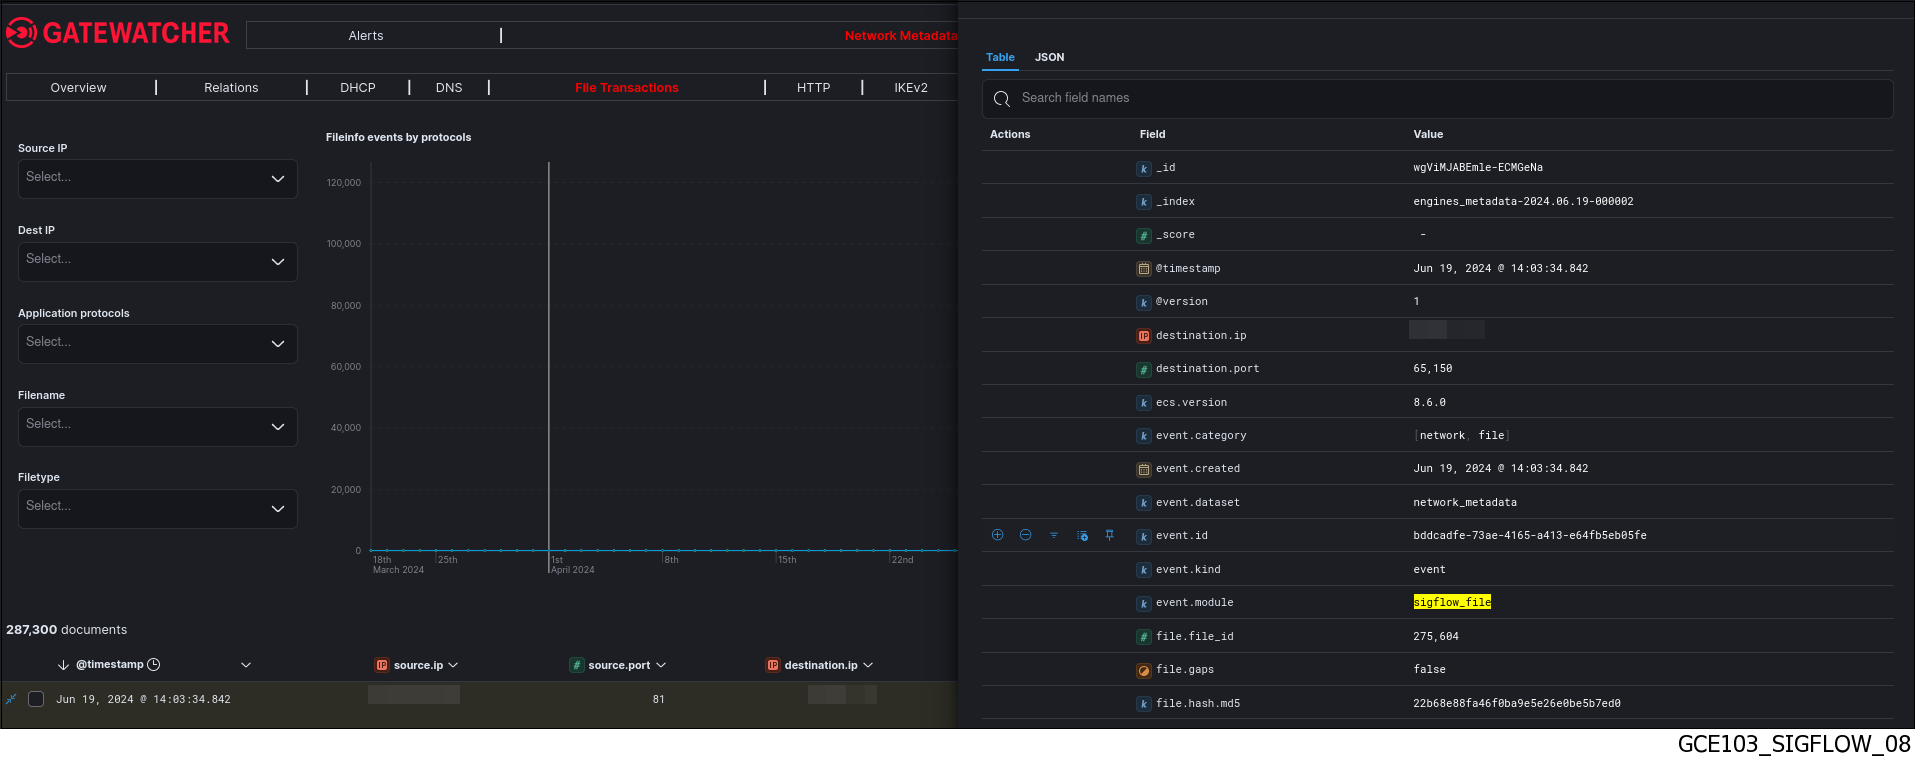 The detailed information (2) of this event can be viewed in table or json format.
Note
The Kibana UI can also be accessed without any filters via the
`Hunting`icon on the left side menu bar in the WebUI.
2.1.5.3.2.1. Example of the events of type "fileinfo"
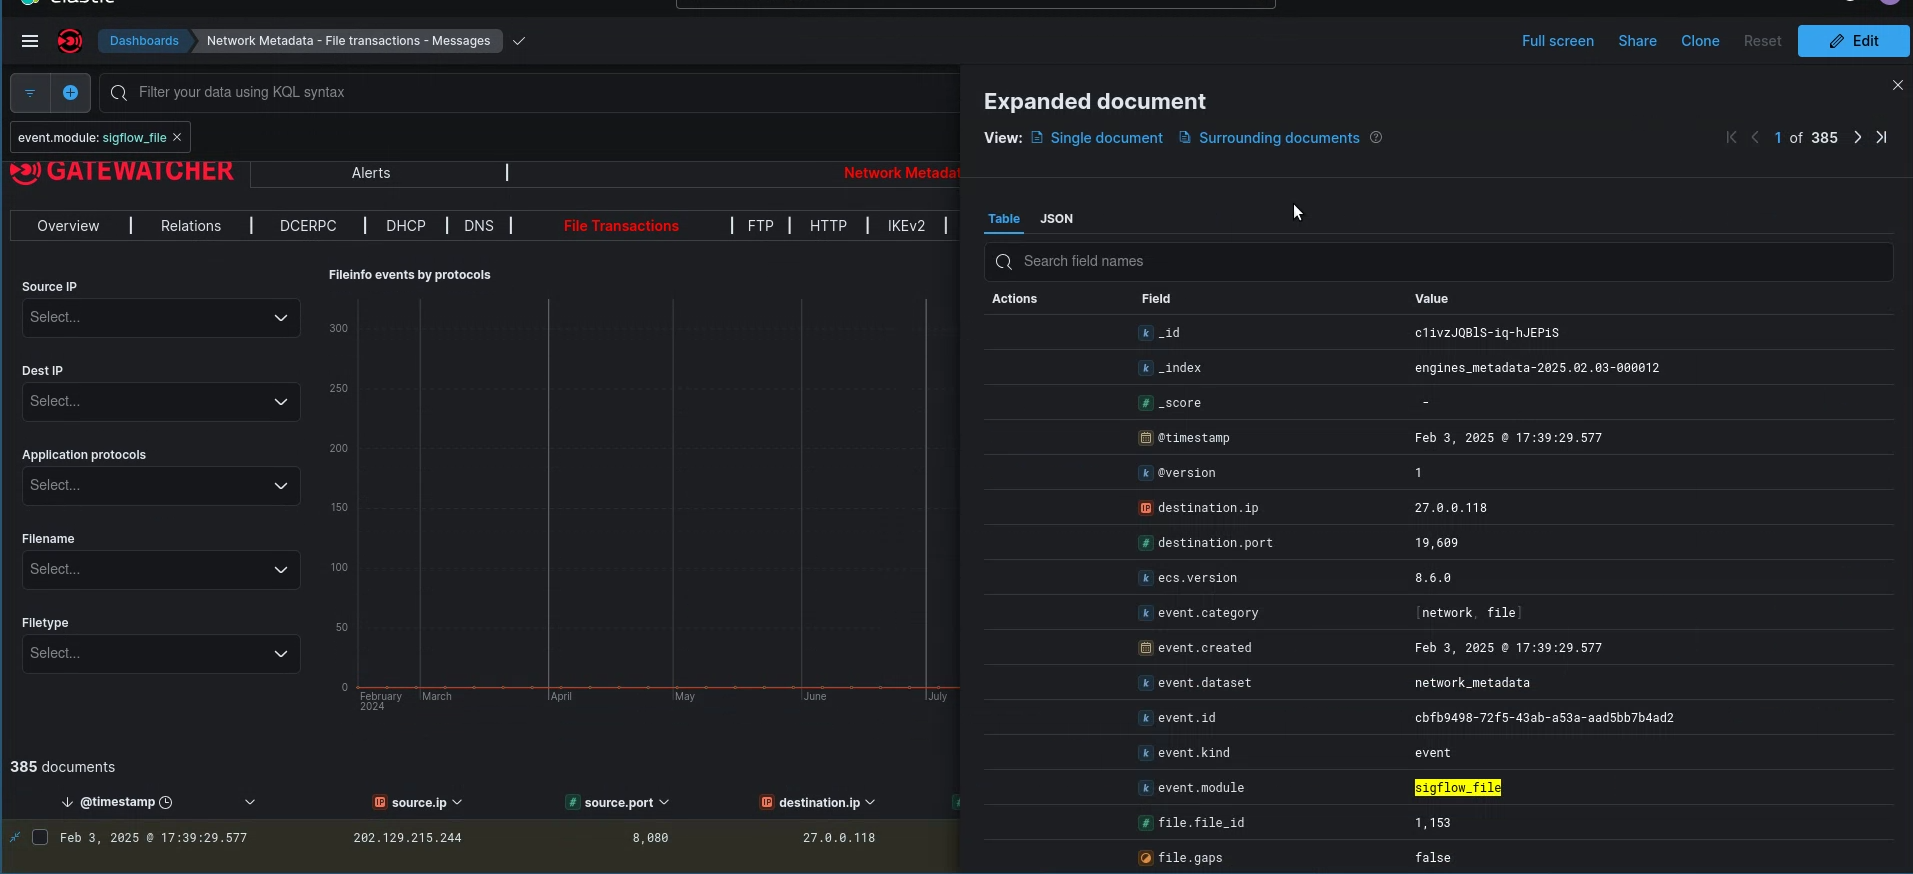
2.1.5.3.2.2. Data structure of the events of type "fileinfo"
The logs are composed of different parts:
The header part
The source part defined by "_source"
The field part defined by "_fields"
This information is displayed in the `Expanded document` screen of Kibana.
2.1.5.3.2.2.1. The header part of the events of type "fileinfo"
The header section contains:
"_index": "engines_metadata-2025.02.03-000012",
"_id": "c1ivzJQBlS-iq-hJEPiS",
"_version": 1,
"_score": 0,
The detailed information is given in the table (Counters of the header part of logs).
2.1.5.3.2.2.2. The source part of the events of type "fileinfo"
The source part defined by "_source" contains:
Note
The example given here is a Kibana example.
"user_agent": {
  "original": "Mozilla/4.0 (compatible; MSIE 8.0; Windows NT 6.1; Trident/4.0; SLCC2; .NET CLR 2.0.50727; .NET CLR 3.5.30729; .NET CLR 3.0.30729)"
},
"destination": {
  "port": 19609,
  "ip": "x.y.z.a"
},
"source": {
  "port": 8080,
  "ip": "a.b.c.d"
},
"event": {
  "dataset": "network_metadata",
  "module": "sigflow_file",
  "category": [
    "network",
    "file"
  ],
  "created": "2025-02-03T16:39:29.577001+0000",
  "id": "cbfb9498-72f5-43ab-a53a-aad5bb7b4ad2",
  "kind": "event"
},
"@version": "1",
"file": {
  "tx_id": 1,
  "magic": "Macromedia Flash data (compressed), version 14",
  "name": "/6SuCHKKkf8Sf1aFXJPqD0R6r3oEDCrbwHFm23EU-Af2zwWdHgpn6mEGu5XlxFust",
  "sid": [
    1100020
  ],
  "state": "CLOSED",
  "file_id": 1153,
  "hash": {
    "sha256": "350836364013549b6a76aab79d57d109df6acc143759e24a952d3ff5d6a76ec4",
    "md5": "67ca9a31f220bc7b68f203c07ad668b9"
  },
  "size": 77068,
  "gaps": false,
  "stored": true
},
"http": {
  "http_refer": "http://tsevid-synonymi.justdanceatsea.com:8080/ndf4xx22ci.php",
  "response": {
    "mime_type": "application/x-shockwave-flash",
    "status": 200,
    "bytes": 77068
  },
  "hostname": "tsevid-synonymi.justdanceatsea.com",
  "http_port": 8080,
  "version": "HTTP/1.1",
  "request": {
    "method": "GET"
  }
},
"url": {
  "domain": "tsevid-synonymi.justdanceatsea.com",
  "path": "/6SuCHKKkf8Sf1aFXJPqD0R6r3oEDCrbwHFm23EU-Af2zwWdHgpn6mEGu5XlxFust"
},
"observer": {
  "product": "gcenter",
  "uuid": "78f4fed1-c9ad-52b9-b509-6b87767f501f",
  "hostname": "gcenter.domain.local",
  "gcap": {
    "ingress": {
      "interface": {
        "name": "monvirt"
      }
    },
    "hostname": "gcap.gatewatcher.fr",
    "version": "2.5.x"
  },
  "version": "2.5.x",
  "vendor": "gatewatcher",
  "log_format_version": "1.0.0"
},
"@timestamp": "2025-02-03T16:39:29.577Z",
"ecs": {
  "version": "8.6.0"
},
"network": {
  "protocol": "http",
  "transport": "tcp",
  "timestamp": "2025-02-03T16:39:29.577001+0000",
  "flow_id": 1156097574154966
}
2.1.5.3.2.2.3. List of counters of the events of type "fileinfo"
Note
The alert counters are visible:
In the
`Expanded document`screen of KibanaIn the export to the SIEM
The detailed information is given in the table (Counters of the source part of logs).
2.1.5.3.3. Events of type "meta-data"
- Click on the
`Hunting`icon of the`WebUI`.
Click on the
`Network Metadata`section then the protocol category (HTTP for example).- Click on the
`Messages`tab.This page displays all events of metadata type (metadata) corresponding to the detected protocol in this network flow. - Select the arrow to the left of the event.
 The detailed information of this event can be viewed in table or json format.
2.1.5.3.3.1. Example of the events of type "meta-data"
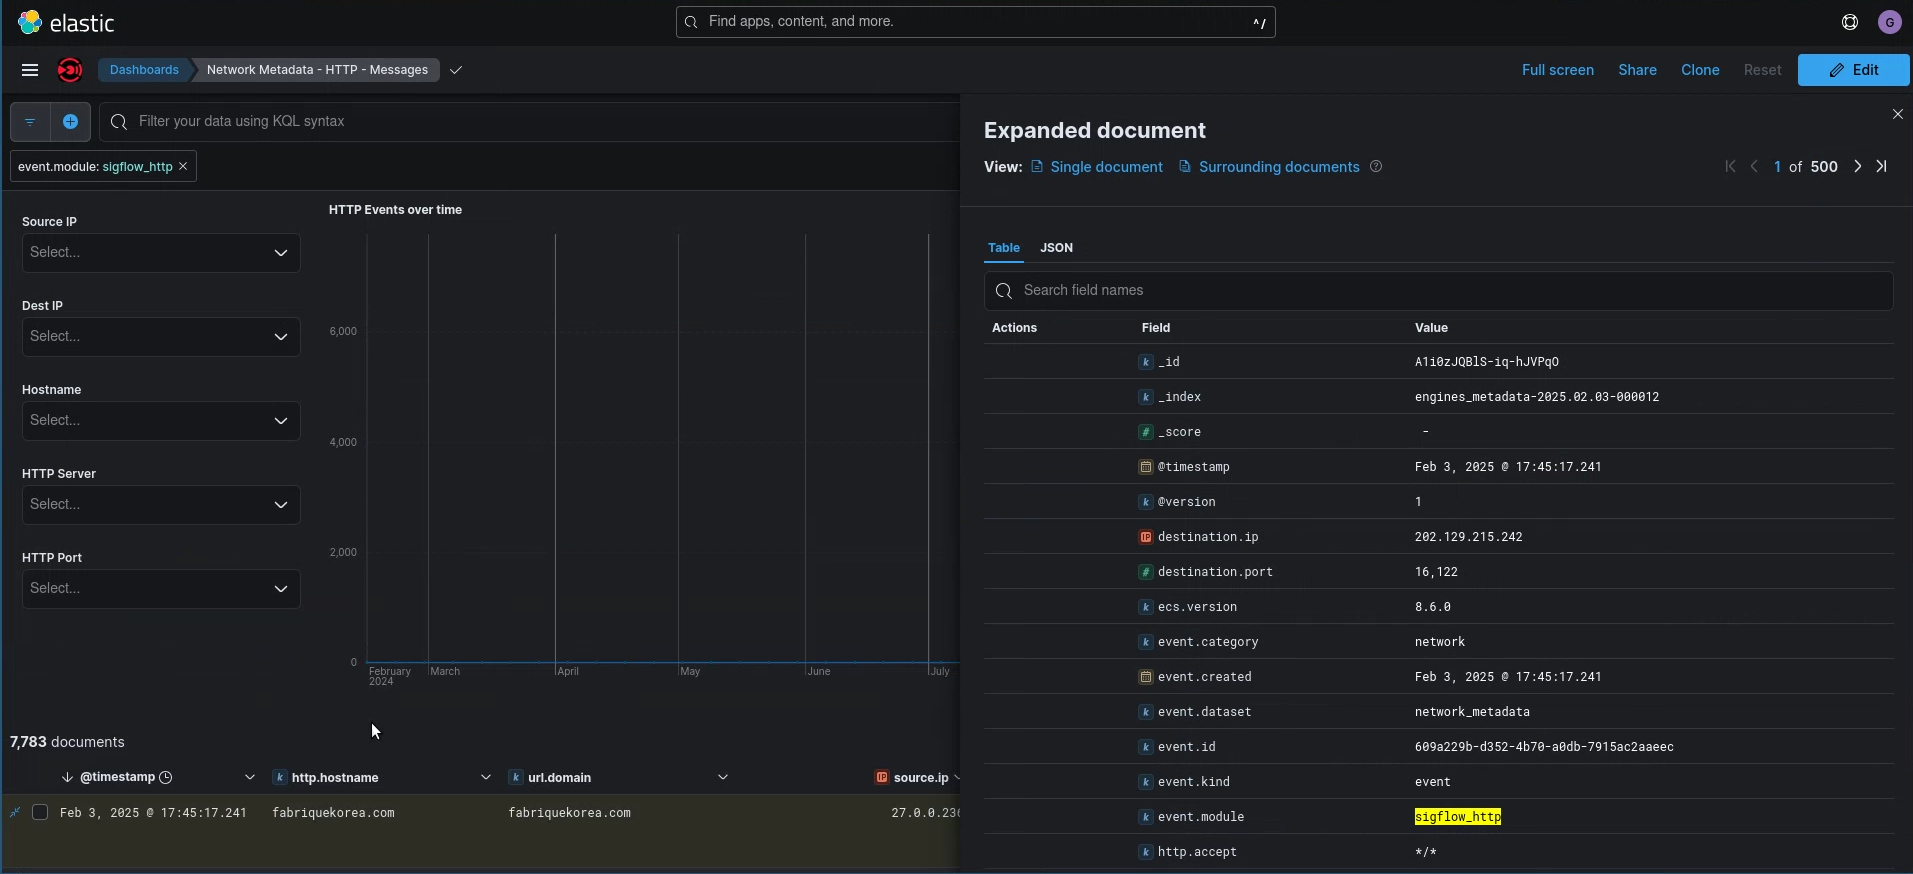
2.1.5.3.3.2. Data structure of the events of type "meta-data"
The logs are composed of different parts:
The header part
The source part defined by "_source"
The field part defined by "_fields"
This information is displayed in the `Expanded document` screen of Kibana.
2.1.5.3.3.2.1. The header part of the events of type "meta-data"
The header section contains:
"_index": "engines_metadata-2025.02.03-000012",
"_id": "A1i0zJQBlS-iq-hJVPqO",
"_version": 1,
"_score": 0,
The detailed information is given in the table (Counters of the header part of logs).
2.1.5.3.3.2.2. The source part of the events of type "meta-data"
The source part defined by "_source" contains:
Note
The example given here is a Kibana example.
 "user_agent": {
  "original": "\"Mozilla/5.2 (Windows NT 6.2; rv:50.2) Gecko/20200103 Firefox/50.2\""
},
"destination": {
  "port": 16122,
  "ip": "x.y.z.a"
},
"source": {
  "port": 62219,
  "ip": "a.b.c.d"
},
"event": {
  "dataset": "network_metadata",
  "module": "sigflow_http",
  "category": [
    "network"
  ],
  "created": "2025-02-03T16:45:17.241433+0000",
  "id": "609a229b-d352-4b70-a0db-7915ac2aaeec",
  "kind": "event"
},
"@version": "1",
"ether": {},
"http": {
  "connection": "Keep-Alive",
  "response": {
    "mime_type": "text/plain",
    "status": 200,
    "bytes": 186503
  },
  "server": "Microsoft-IIS/5.0",
  "date": "Thu, 01 Jun 2017 20:55:46 GMT",
  "version": "HTTP/1.1",
  "request": {
    "mime_type": "text/plain",
    "bytes": 251904,
    "method": "GET"
  },
  "last_modified": "Thu, 01 Jun 2017 20:25:44 GMT",
  "hostname": "fabrique.com",
  "accept": "*/*",
  "accept_encoding": "gzip, deflate",
  "accept_language": "en-US"
},
"url": {
  "domain": "fabrique.com",
  "path": "/7rvmnb"
},
"observer": {
  "product": "gcenter",
  "uuid": "78f4fed1-c9ad-52b9-b509-6b87767f501f",
  "hostname": "gcenter.domain.local",
  "gcap": {
    "ingress": {
      "interface": {
        "name": "monvirt"
      }
    },
    "hostname": "gcap.gatewatcher.fr",
    "version": "2.5.x"
  },
  "version": "2.5.x",
  "vendor": "gatewatcher",
  "log_format_version": "1.0.0"
},
"@timestamp": "2025-02-03T16:45:17.241Z",
"ecs": {
  "version": "8.6.0"
},
"network": {
  "tx_id": 0,
  "protocol": "http",
  "transport": "tcp",
  "community_id": "1:cxHEBTJgZCFfWpryH1AkluiYEGk=",
  "timestamp": "2025-02-03T16:45:17.241433+0000",
  "flow_id": 575568319996003
}
2.1.5.3.3.2.3. List of counters of the events of type "meta-data"
Note
The alert counters are visible:
In the
`Expanded document`screen of KibanaIn the export to the SIEM
The detailed information is given in the table (Counters of the source part of logs).
2.1.5.4. Management of the engine
2.1.5.4.1. View the status of Sigflow
The current engine status is displayed in the `Health checks` screen.