5.3. Overview of the Kibana GUI
5.3.1. Overview of the Kibana GUI
Come from analyzes on the GCap side (alerts and metadata reported by the Sigflow detection engine)
Come from analyzes on the GCenter side (alerts by the other detection engines)
Important
This section describes the graphic elements accessible to members of the operator group.
5.3.2. Configuration of the Kibana GUI
Users who are members of the group operator can view the data present in the detection event dashboards
Users who are members of the group administrator can view the data present in the system dashboards (System logs)
Note
Kibana interface access is available:
For members of the operator group, by clicking on the
`Hunting`button on the navigation barFor members of the administrator group, by clicking on the command
`System logs`from the menu`Administration - Maintenance`
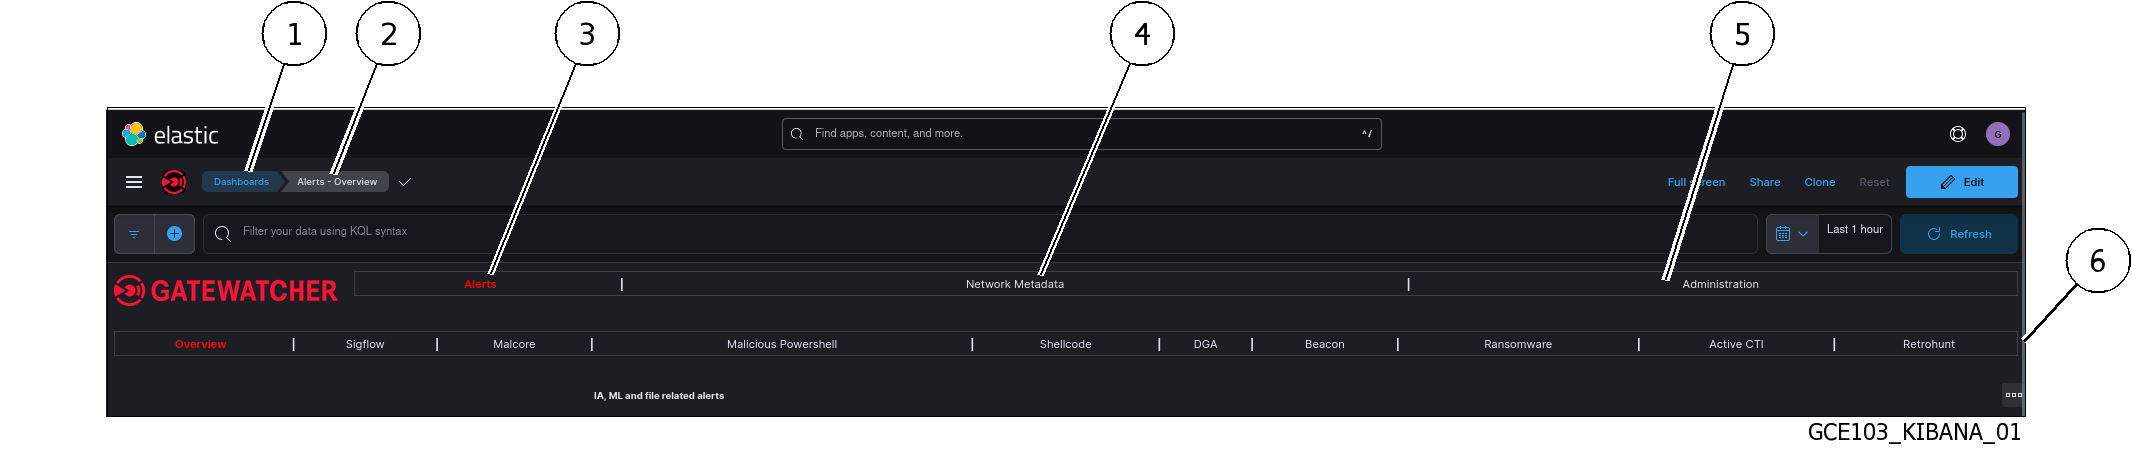
`Dashboards` button (1) enables to display and to select the existing dashboards.`Alerts - Overview` (2) is the default dashboard for members of the operator group.5.3.3. Main tabs
There are main tabs:
`Alerts`tab (3) : displays the Alert dashboards created by the detection engines (see Native dashboards of the `Alerts` tab)The native dashboards (6) of the`Alerts`tab (3) are displayed below.`Network Metadata`tab (4) : displays the network dashboards (see Native dashboards of the `Network Metadata` tab)`Administration`(5): displays the Administration dashboards (see Native dashboards of the `Administration` tab)
5.3.4. Native dashboards of the `Alerts` tab
The `Alerts` information of the different engines is grouped in the Kibana interface as tabs (6):
Tab |
Displays all alerts generated by the |
|---|---|
|
GCenter |
|
Sigflow engine |
|
Malcore engine |
|
Malicious Powershell detect engine |
|
Shellcode detect engine |
|
DGA detect engine |
|
Beacon detect engine |
|
Ransomware detect engine |
|
Active CTI engine |
|
Retro hunt engine |
Note
For most dashboards, the following pages are available:
`Overview`
`Messages`
a graph showing the number of alerts per engine over time
a counter displaying the number of alerts per engine, the number of metadata and the number of files scanned
a top 10 source IP addresses by type of alert
a top 10 destination IP addresses by type of alert
a graph showing the proportion of the different severity of Sigflow alerts
a graph showing the number of unique signatures that escalated alerts over time
a list of Malcore alerts identified by the solution (in the form of a message)
a top 10 alerts
a top in the distribution of DGA domain names
Top 10 Machine Learning Alerts
`Overview` shows different graphs and statistics for the selected time slot.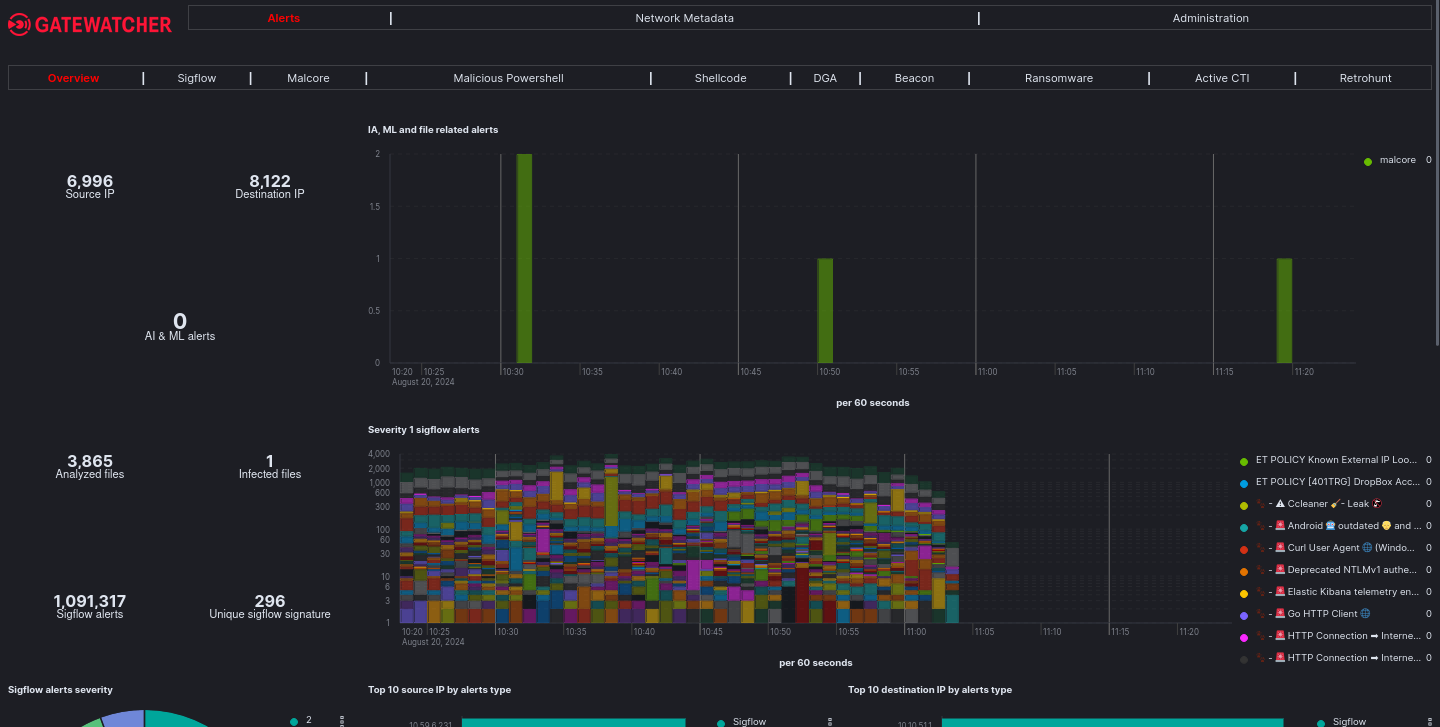
`Messages` to display the list of alerts.`Messages` shows a histogram and the list of alerts.Do not display healthy machines (filter false positives)
Show only alerts from a particular IP
Do not display alerts from a specific GCap
5.3.5. Native dashboards of the `Network Metadata` tab
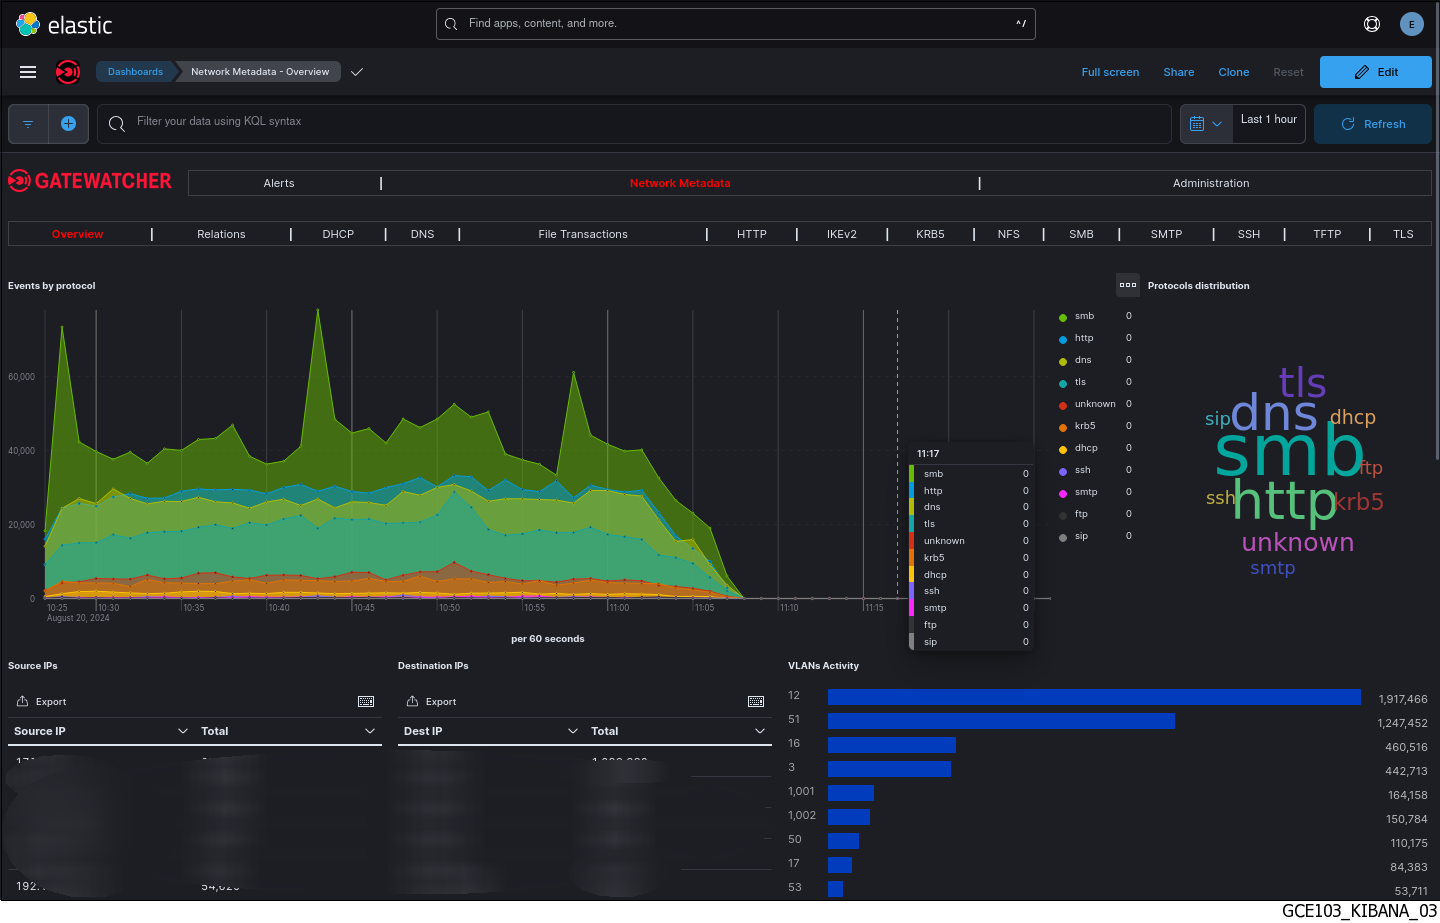
`Network Metadata` displays, in sub-tabs, the metadata for the different protocols analyzed by the GCap:
Overview synthesizes all metadata
Relations synthesizes all metadata into visualizations in chart form
DHCP, DHCP metadata details
DNS, DNS metadata details
File Transaction, details of the metadata related to the file reconstructed by the probe
HTTP, HTTP metadata details
IKEv2, IKEv2 metadata details
KRB5, KRB5 metadata details
NFS, NFS protocol metadata details
SMB, SMB metadata details
SMTP, SMTP metadata details
SSH, SSH metadata details
TFTP, TFTP metadata details
TLS, TLS metadata details
Attention
5.3.6. Native dashboards of the `Administration` tab
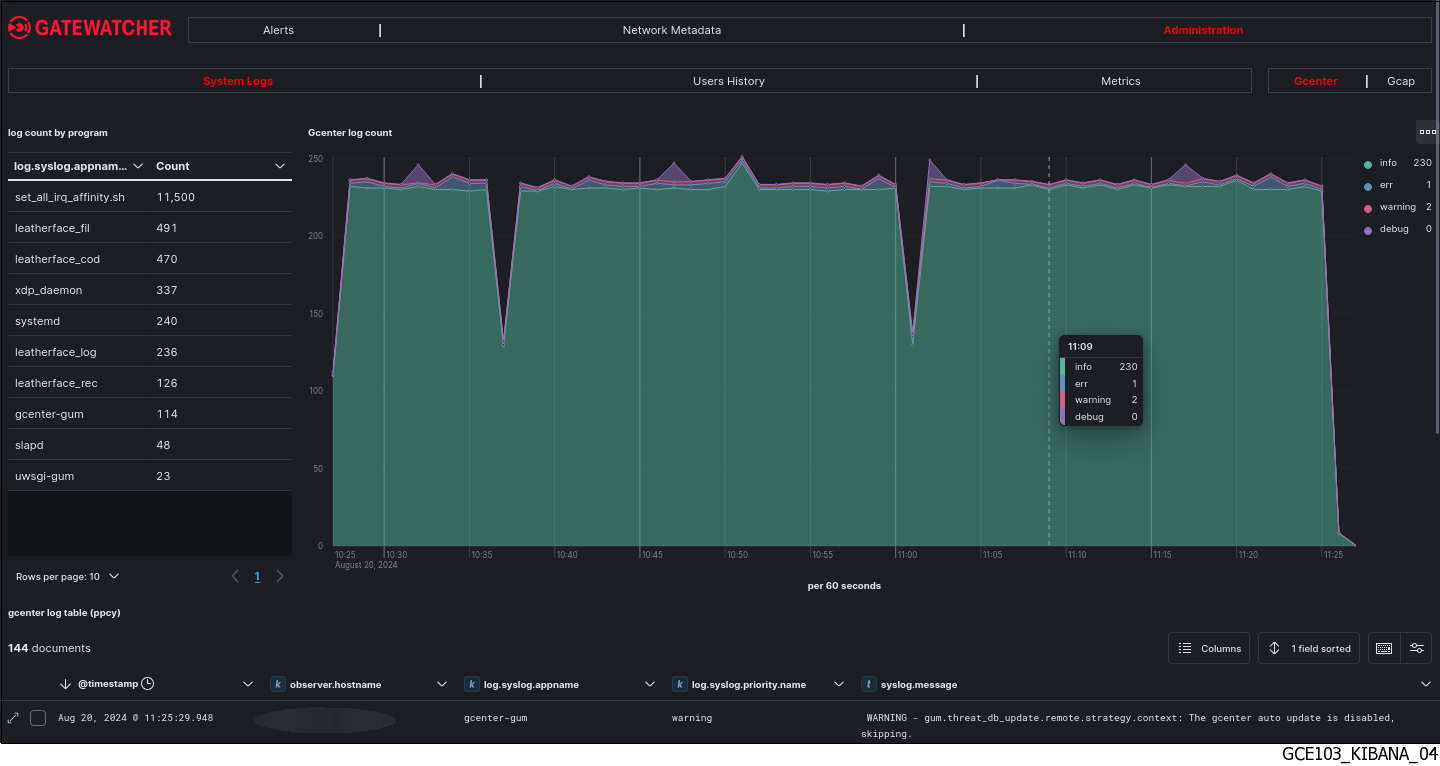
`Administration` tab displays, in sub-tabs, the information grouped by theme:`System Logs`displays the syslog system events`Users History`displays the Users history events`Metrics`displays the Administration metrics
5.3.7. Data exploitation
Filter by changing the time interval (top right of page)
Filter by searching using the
`Search`bar (top left)Filter by creating a filter on a specific field of the desired events (button
`+ Add filter`below the search bar)