2.1.6. DGA detect engine
2.1.6.1. Introduction
2.1.6.1.1. For what types of threats is this engine designed?
Works on DNS (plaintext protocol) and will work even if the malware later uses ciphered protocol like HTTPS.
Can detect DGA that have never be seen before. For instance, it could have detected solarwind even if it was trained before solarwind existed.
2.1.6.1.2. How does this particular engine detect threats?
A supervised machine learning algorithm to detect likely-DGA domains. The model is based on multiple models, one using deep learning (LSTM) and one using domain-specific features.
A behavior analysis based on aggregation over time
2.1.6.1.3. How does this DGA detect engine work in the GCenter?
On the GCAP, DNS answers are logged and sent to the GCenter.
A machine learning algorithm detects the domains that look like being produced by a DGA
A behavior analysis is performed to detect hosts that are associated with an unusual amount of NXDOMAIN DNS answers (=host that produce a lot of queries for domain that don’t exist)
The results from the behavior analysis and from each individual domain are combined to produce an aggregated alert.
What are real-life examples of DGA ?
Conficker:
One of the earliest and most well-known examples of a DGA is from the Conficker worm, which infected millions of computers worldwide.
Conficker’s DGA generated 250 domains daily, making it difficult for defenders to block the domains fast enough.
Zeus Gameover: The Zeus Gameover malware also used a DGA to generate domain names, helping it evade detection and take control of infected machines for financial theft.
How DGA works?
Why an attacker would use DGA?
What are the different types of DGA?
2.1.6.2. Events generated
These are displayed:
`Alerts`screen.The main interface named WebUI is described in Overview of the WEB UI.
`DGA`engine filter.See the presentation of the WebUI `Alerts` screen.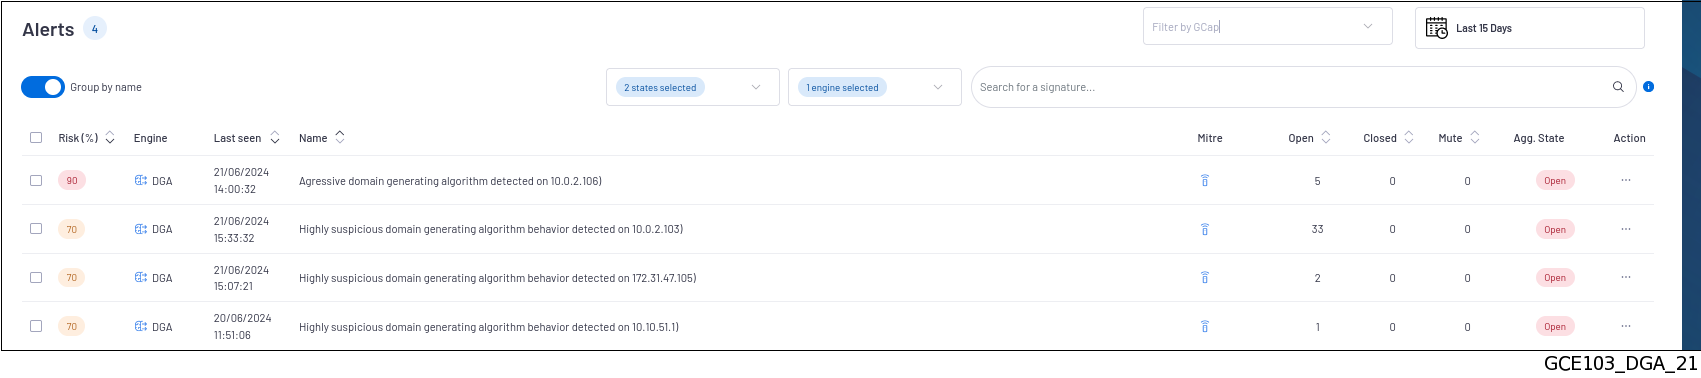
`Alert details`window is displayed.The detailed information of this alert is displayed in Example of a DGA detect alert in the WebUI.
`DGA`engine filter.See the presentation of the WebUI `Alerts` screen.The screen displays only the list of DGA alerts.`Open DGA activity`command of the`Actions`menu.Kibana interface is opened in the`Overview`tab, the`DGA`category of the`Alerts `section.The database is filtered on the`source.ip:`parameter which sends the DGA request.The interface displayed is the interface named Kibana UI (described in Overview of the Kibana GUI).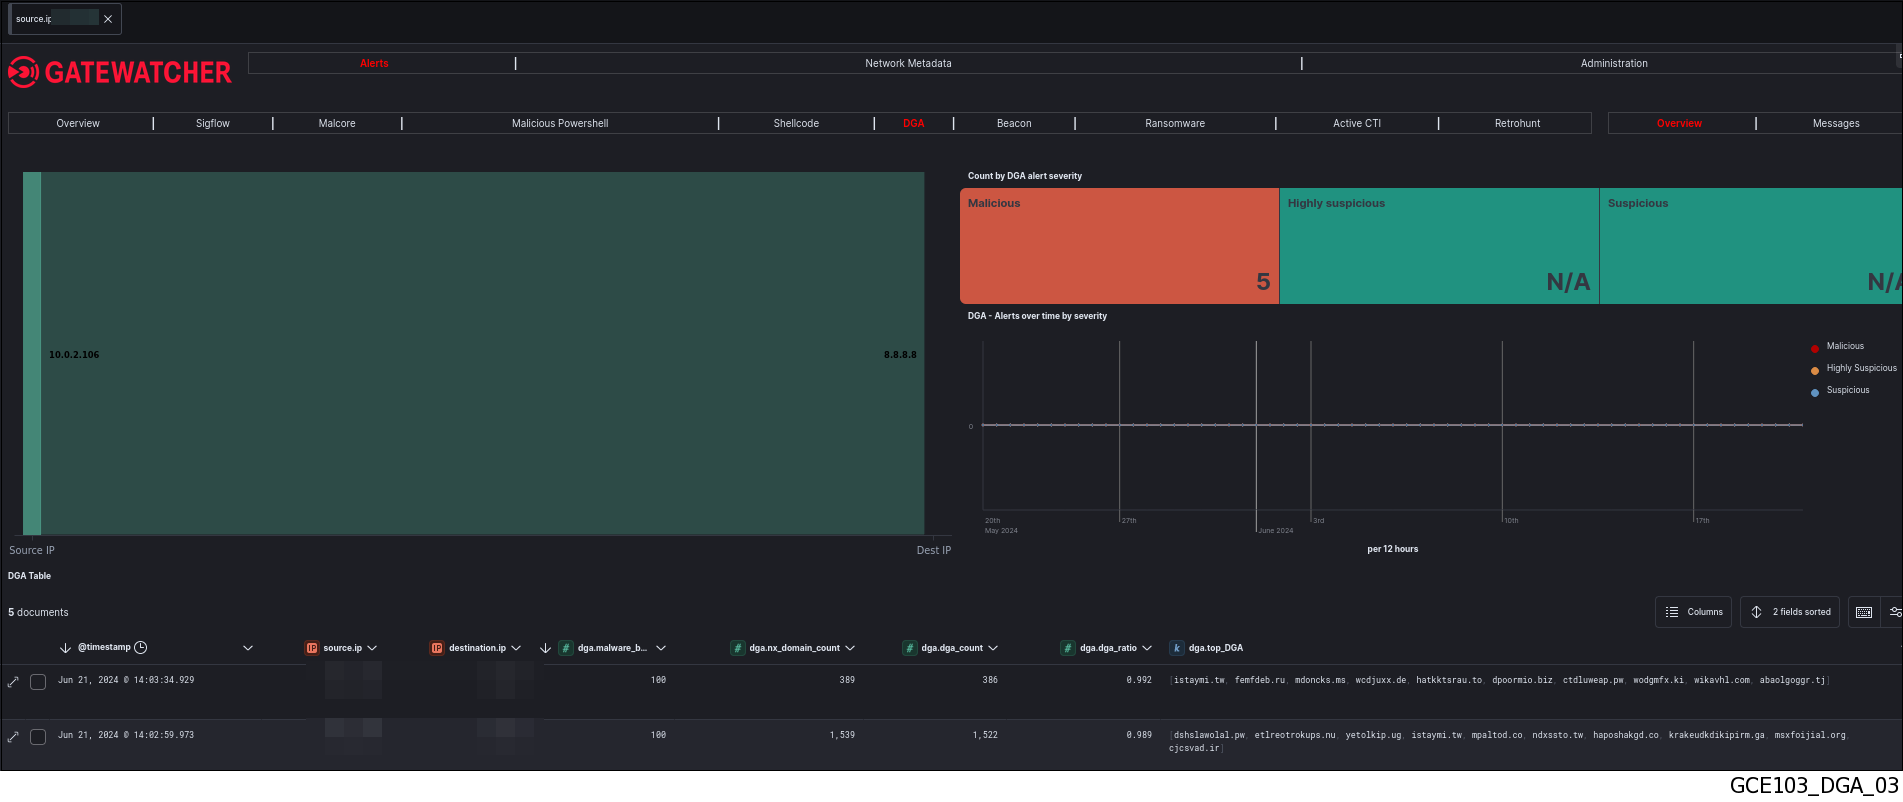 This page displays all alerts from this IP address detected by DGA.
`Expanded document`window (2) is displayed.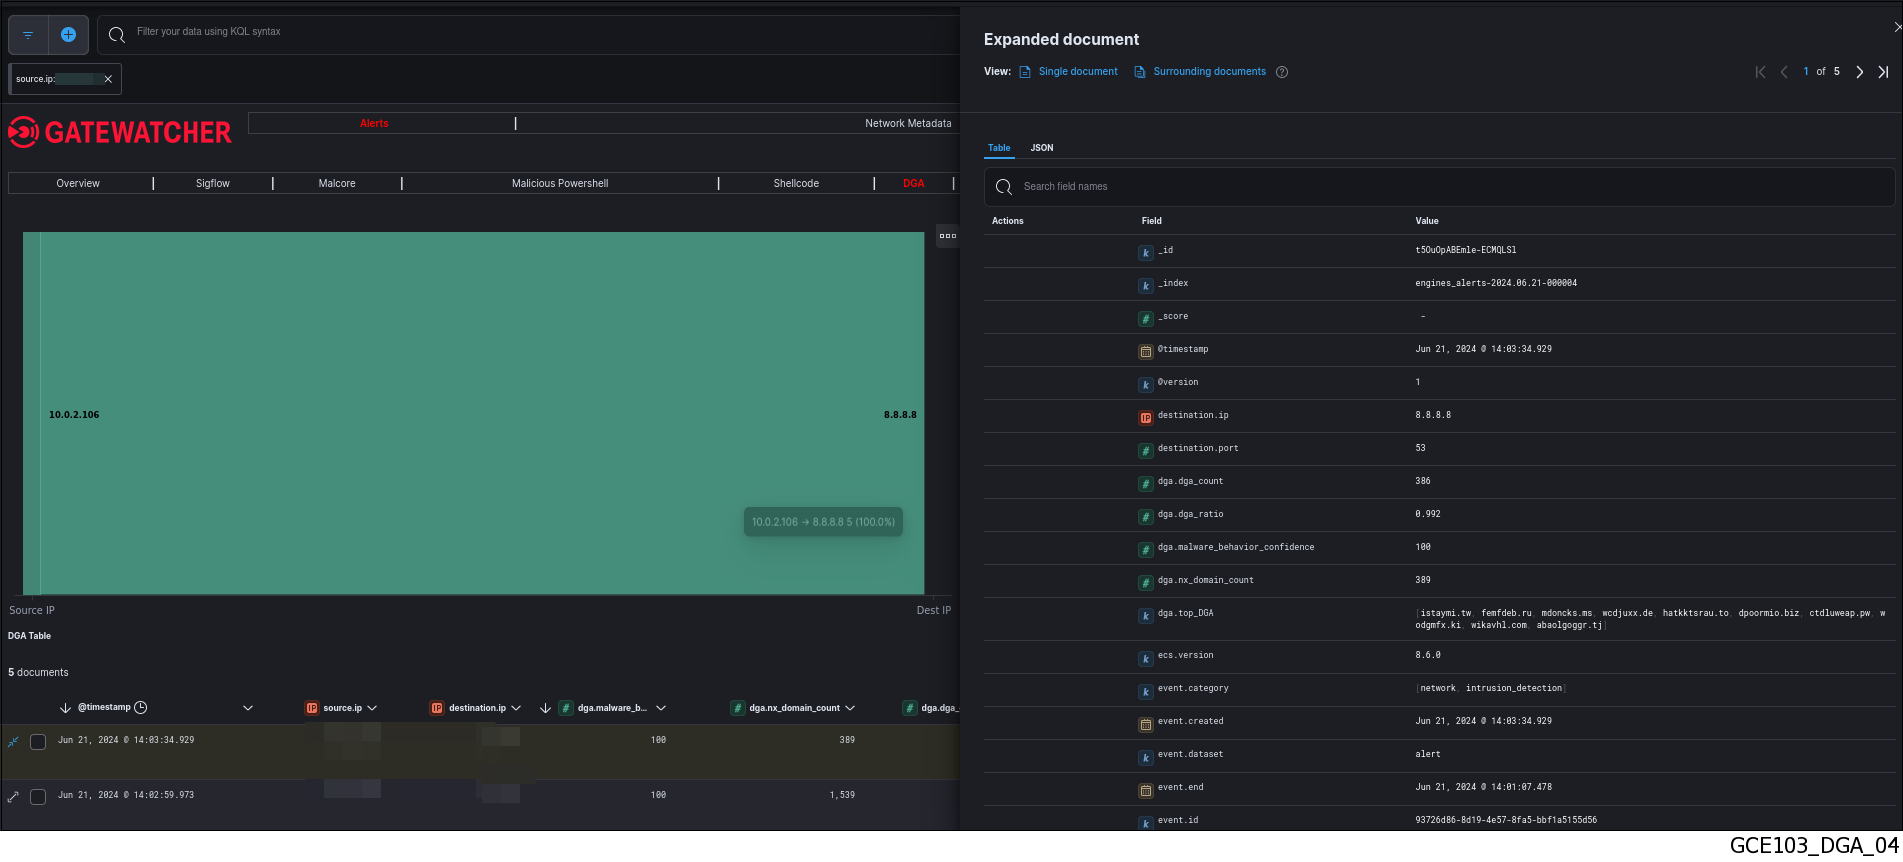 The detailed information of this alert can be viewed in table or json format (see the DGA detect log data structure).The displayed counters are given in the Engine log data structure appendix.
Note
If a GCap oversees several networks or if several GCaps supervise several networks, it is possible that a domain name that appears several times will generate only one alert.
2.1.6.2.1. Example of a DGA detect alert in the WebUI
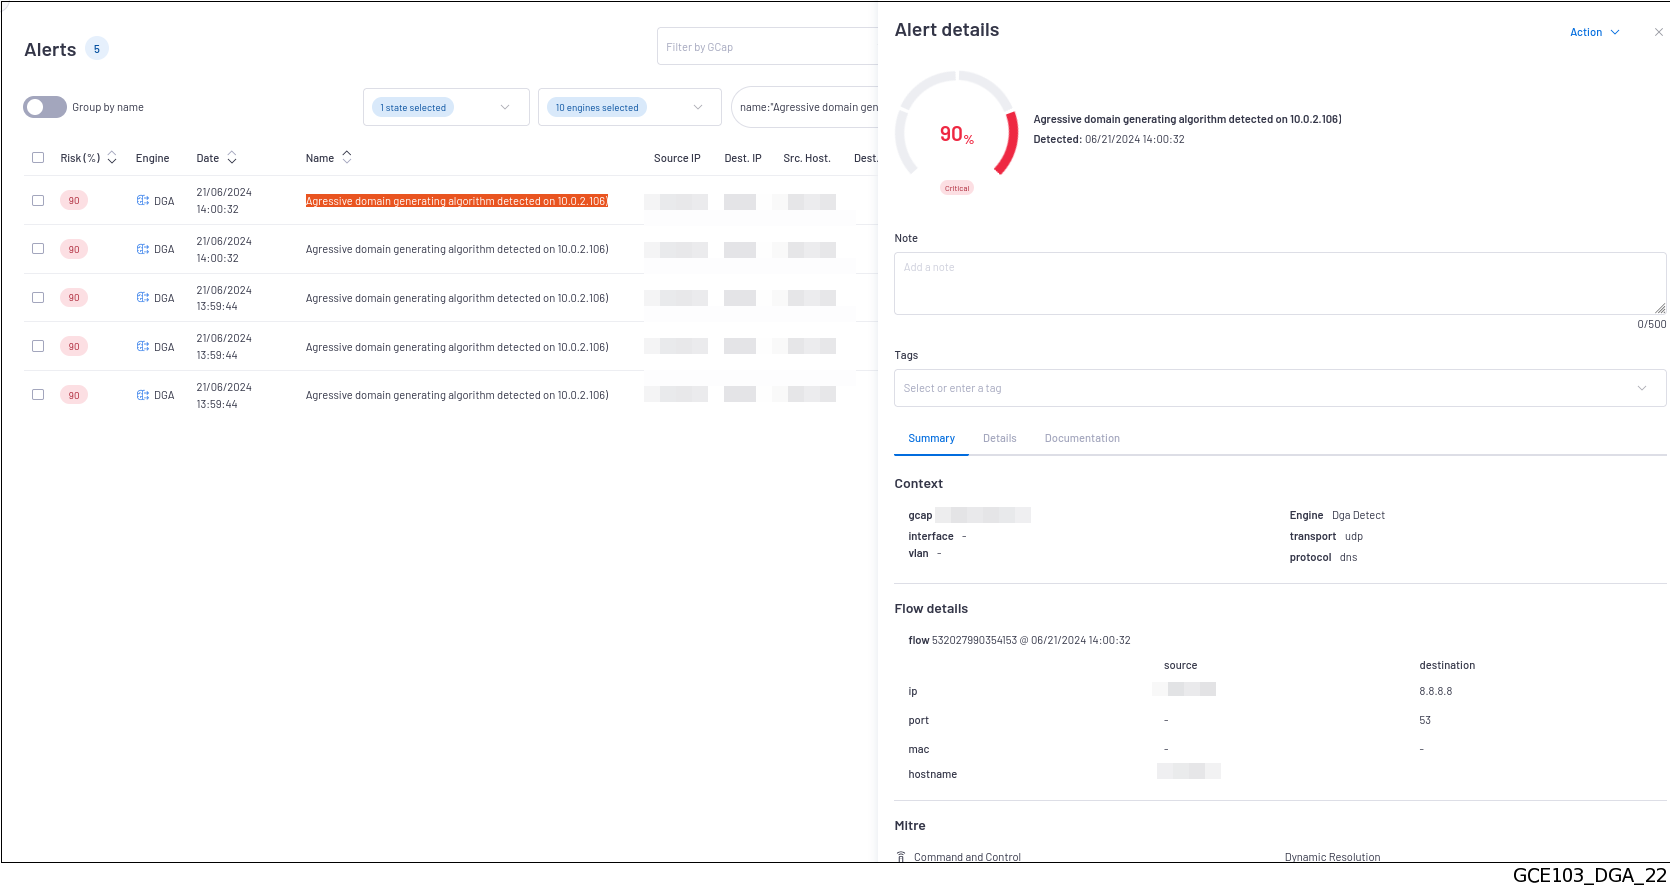
`Alert details` window is given in the `Alert details` window.2.1.6.2.2. DGA detect log data structure
The logs are composed of different parts:
The header part
The source part defined by "_source"
The field part defined by "_fields"
This information is displayed in the `Expanded document` screen of Kibana.
2.1.6.2.2.1. The header part of the DGA detect logs
The header section contains:
"_index": "engines_alerts-2024.12.17-000043",
"_id": "-a9H1JMBe7GX5B2fgaSz",
"_version": 1,
"_score": 0,
The detailed information is given in the table (Counters of the header part of logs).
2.1.6.2.2.2. The source part of the DGA detect logs
The source part is defined by "_source" in the logs.
Note
`Extended document` screen on the Kibana interface.The example given here is a Kibana example.
  "event": {
    "created": "2024-12-17T11:01:15.955324+00:00",
    "dataset": "alert",
    "end": "2024-12-17T11:00:05.717000+00:00",
    "module": "dga_detect",
    "severity": 1,
    "kind": "alert",
    "category": [
      "network",
      "intrusion_detection"
    ],
    "start": "2024-12-17T10:59:59.513000+00:00",
    "id": "113dfa89-3b96-4e93-af67-e11df6446ff0"
  },
  "dga": {
    "malware_behavior_confidence": 50,
    "nx_domain_count": 29,
    "dga_ratio": 1,
    "top_DGA": [
      "tjzjyiheo.com",
      "nvtcvimt.com",
      "vmfyaxnse.com",
      "htjykhvta.com",
      "csmanuivsrlx.com",
      "sbxsgfddr.com",
      "oyttwuyshcgxxaenbit.com",
      "seklusaprnkwhvybzc.com",
      "xxcnirvbqivbucfsbliu.com",
      "jgjvgfetpammdrxwn.com"
    ],
    "dga_count": 29
  },
  "source": {
    "ip": "192.168.56.104"
  },
  "ecs": {
    "version": "8.6.0"
  },
  "destination": {
    "port": 53,
    "ip": "78.46.218.253"
  },
  "observer": {
    "log_format_version": "1.0.0",
    "hostname": "gcenter.domain.local",
    "vendor": "gatewatcher",
    "gcap": {
      "hostname": "gcap-int-129-dag.gatewatcher.com",
      "version": "2.5.4.0-rc5"
    },
    "product": "gcenter",
    "uuid": "fc1e66e3-a397-5eb4-9277-754be778f317",
    "version": "2.5.3.103"
  },
  "@version": "1",
  "@timestamp": "2024-12-17T11:01:15.955Z",
  "network": {
    "protocol": "dns",
    "transport": "udp",
    "timestamp": "2024-12-17T11:00:05.434623+00:00",
    "flow_id": 2110172624313946
  }
},
`dga_probability` will be added.2.1.6.2.2.3. List of counters of the alert
Note
The alert counters are visible:
In the
`Alert details`screen of the WebUIIn the
`Expanded document`screen of KibanaIn the export to the SIEM
The detailed information is given in the table (Counters of the source part of logs).
2.1.6.3. Management of the engine
2.1.6.3.1. Viewing the engine status
The current engine status is displayed in the `Health checks` screen.
2.1.6.3.3. Configure the DGA detect engine and manage the list of ignored files
The management interface enables:
- To activate the engine and change its settingsConfiguration implementation is given in Setting up the DGA detect engine procedure.
- To manage the
`Ignore list`: defines the list to explicitly filter healthy domains or IPsFor more information on the procedure, see Managing the Ignore list of the DGA detect engine.
The management interface is described in `DGA detect` screen (DGA command).