7.6. Using of NDR dashboards
7.6.1. Introduction
Analyzing the alerts for each type of engine
Viewing information and alerts specific to the network's equipment
Viewing information and alerts specific to the network's users
Viewing the relationships between the different equipment and users
To |
Apply the procedures |
|---|---|
Retrieving information related to an alert |
|
Processing equipment |
|
Processing an user |
|
Managing association rules |
|
Relation between equipment and users |
Procedure to analyze the relationship between equipment and users |
7.6.2. Links associated
See the Overview of the WEB UI.
7.6.3. Prerequisites
User: member of Operator group
7.6.4. Preliminary operations
Login to GCenter via a browser (see Connection to the GCenter web interface via a web browser)
7.6.6. Procedure to process the equipment
Click on the desired equipment.
Analyze the various alerts (1) noted for this equipment.
If necessary, add a tag (9) that will give status to the equipment.
If necessary, add a note (10) to indicate the different analyzes performed.
7.6.7. Procedure to process the users
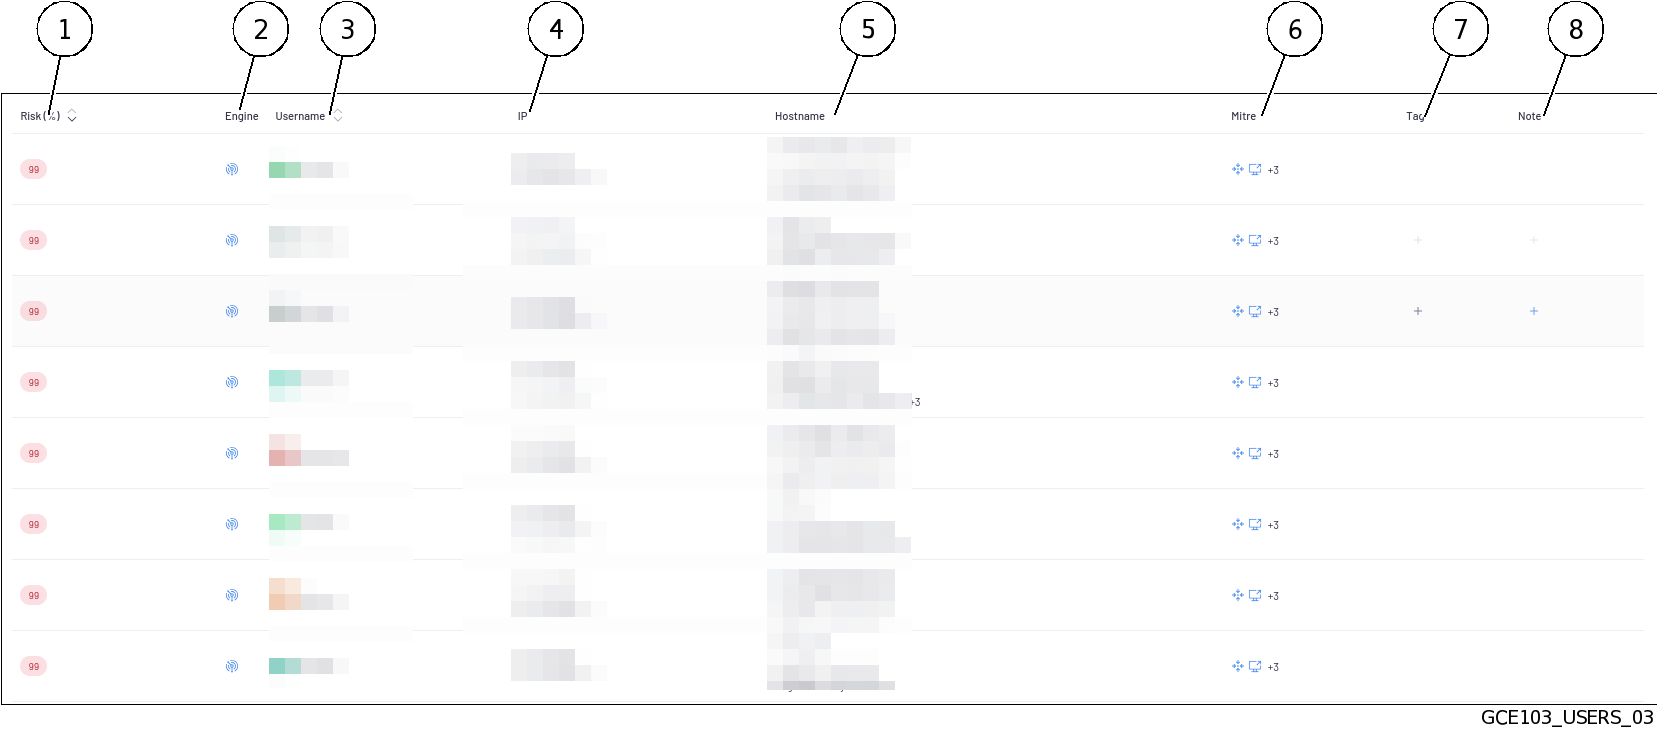
 The active user management interface provides a list of the different users on the network listed by risk score (1).The user with the highest risk score are those that have raised the most high criticality alerts.It may therefore be necessary to carry out an in-depth analysis of the user in question.
Click on the desired user.
Analyze the various alerts noted for this user.
If necessary, add a tag (7) to give the user a status.
If necessary, add a note (8) to indicate the different analyzes performed.
7.6.8. Procedure to manage association rules
From the navigation bar, click successively on :
In the
`Asset detection network range`section:- Click on the
`Network variables can be configured for each GCap`link to add internal networks via the GCap profile customization feature.For more information, see the `Asset detection network range` section of the `Assets/Users Association rules` screen.
In the
`Ignored IP for users association`section:- Declare IP addresses that cannot be associated with a user to avoid wrong associations.For more information, see the `Ignored IP for users association` section of the `Assets/Users Association rules` screen.
In the
`Ignored MAC for assets association`section:- Declare MAC addresses that cannot be associated with equipment to avoid wrong associations.For more information, see the `Ignored MAC for assets association` section of the `Assets/Users Association rules` screen.
In the
`Forbidden users`section:- Declare users not to appear in NDR dashboards (example: CEO, administrator).For more information, see the `Forbidden users` section on the `Assets/Users Association rules` screen.
In the
`Forbidden assets`section:- Declare the equipment not to appear in the NDR dashboards (example: sensitive equipment, irrelevant equipment).For more information, see the `Forbidden assets` section on the `Assets/Users Association rules` screen.
7.6.9. Procedure to analyze the relationship between equipment and users
Choose the desired period using the timeline at the bottom of the page.
Locate a user or equipment flashing red (risk score > 75%).
Click on it, its interactions with other users and equipment are activated and a popup is displayed.
Move the mouse over the activated links (interactions) to see what they mean.
In the popup, the elements enabling further investigation are shown:
The main information about the item
Alerts raised by the item