7.5.3. Analyzing the Malicious Powershell detect alerts
7.5.3.1. Introduction
For information, see the following paragraphs:
7.5.3.1.1. Management of the Malicious Powershell Detect engine
7.5.3.1.2. Events generated by the engine
- In the main interface named WebUI of the GCenter in the
`Alerts`screen:The main interface named WebUI is described in Overview of the WEB UI.- To display only these alerts, select the
`Malicious Powershell`engine filter then validate.See the presentation of the WebUI `Alerts` screen.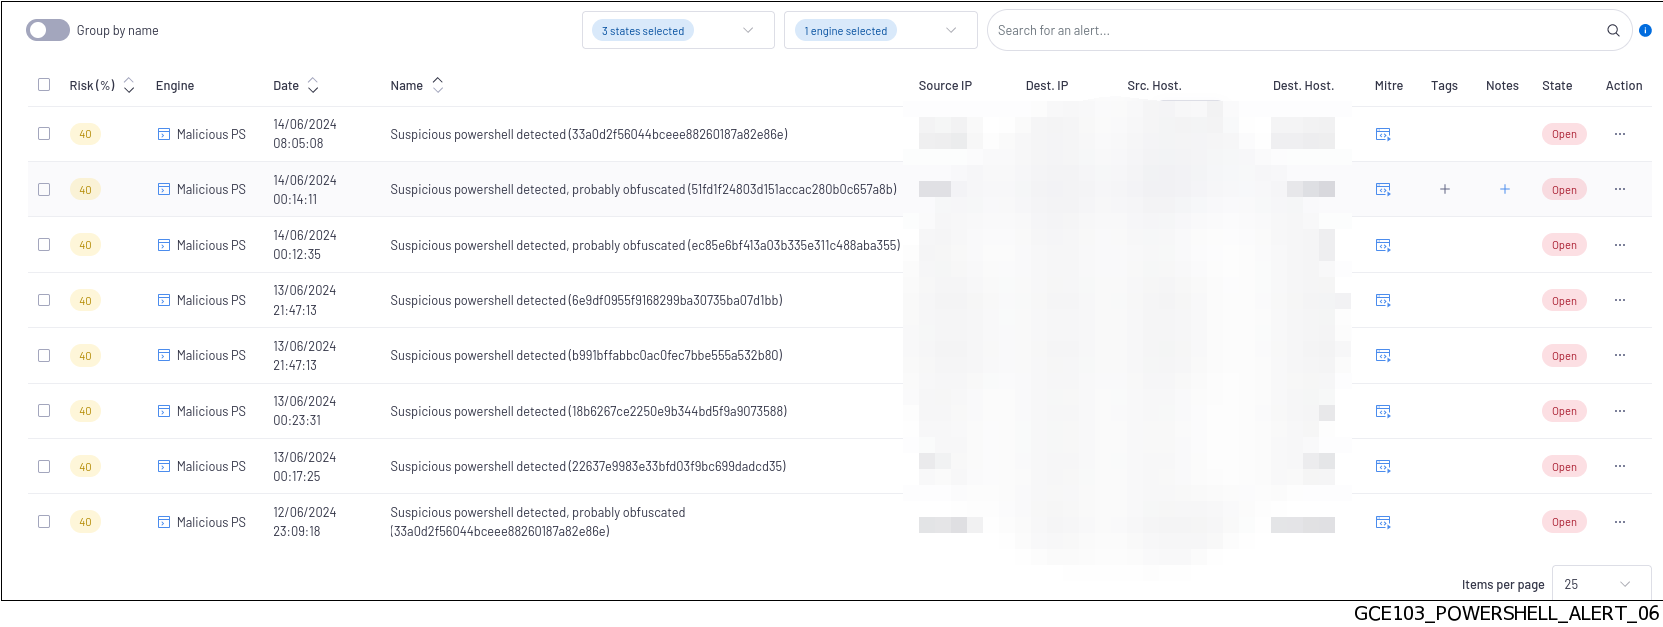
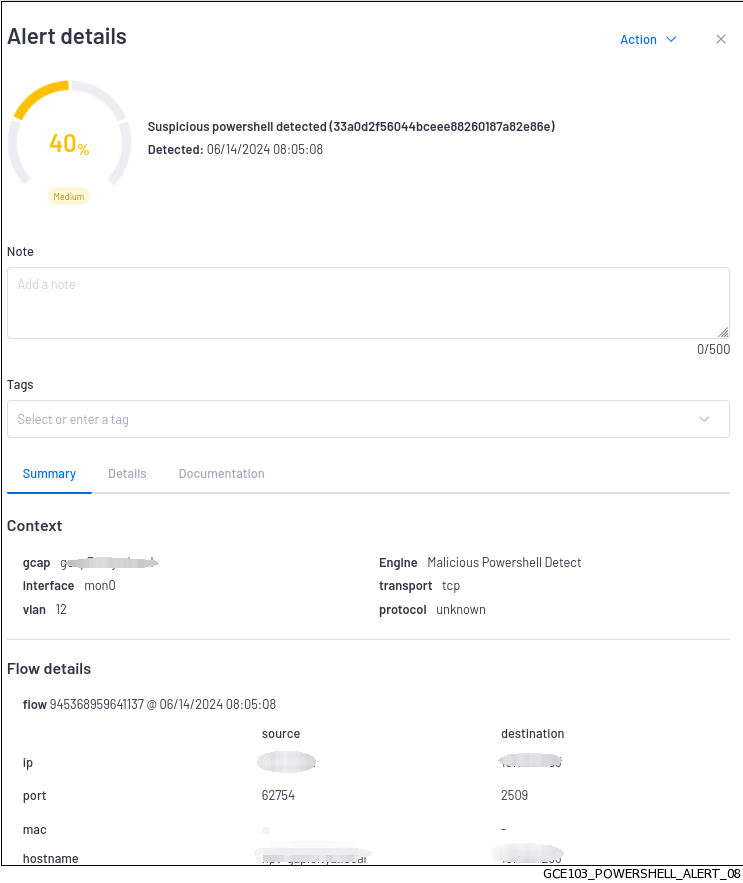
`Alert details`window is displayed.The detailed information of this alert is displayed in Example of a Malicious Powershell detect alert in the WebUIThe displayed counters are given in the Engine log data structure appendix.
`Group by name`mode is activated, the name of the aggregated alerts and their number are displayed.Click on a grouping of alerts to display the list.`Group by name`mode is disabled, different Source and Destination information is displayed for each alert.`Tags`and`Notes`are also visible and editable.The various Quick Access`Actions`are available for each alert.
- In the interface named Kibana UI:
- In the
`Alerts`screen of the WebUI, select the`Malicious Powershell`engine filter then validate.See the presentation of the WebUI `Alerts` screen.
- After selecting the alert, click on the
`Open powershell engine analytics`command of the`Actions`menu.Kibana is opened on the`Malicious Powershell`category of the`Alerts `section: in the`Overview`tab, the database displays all alerts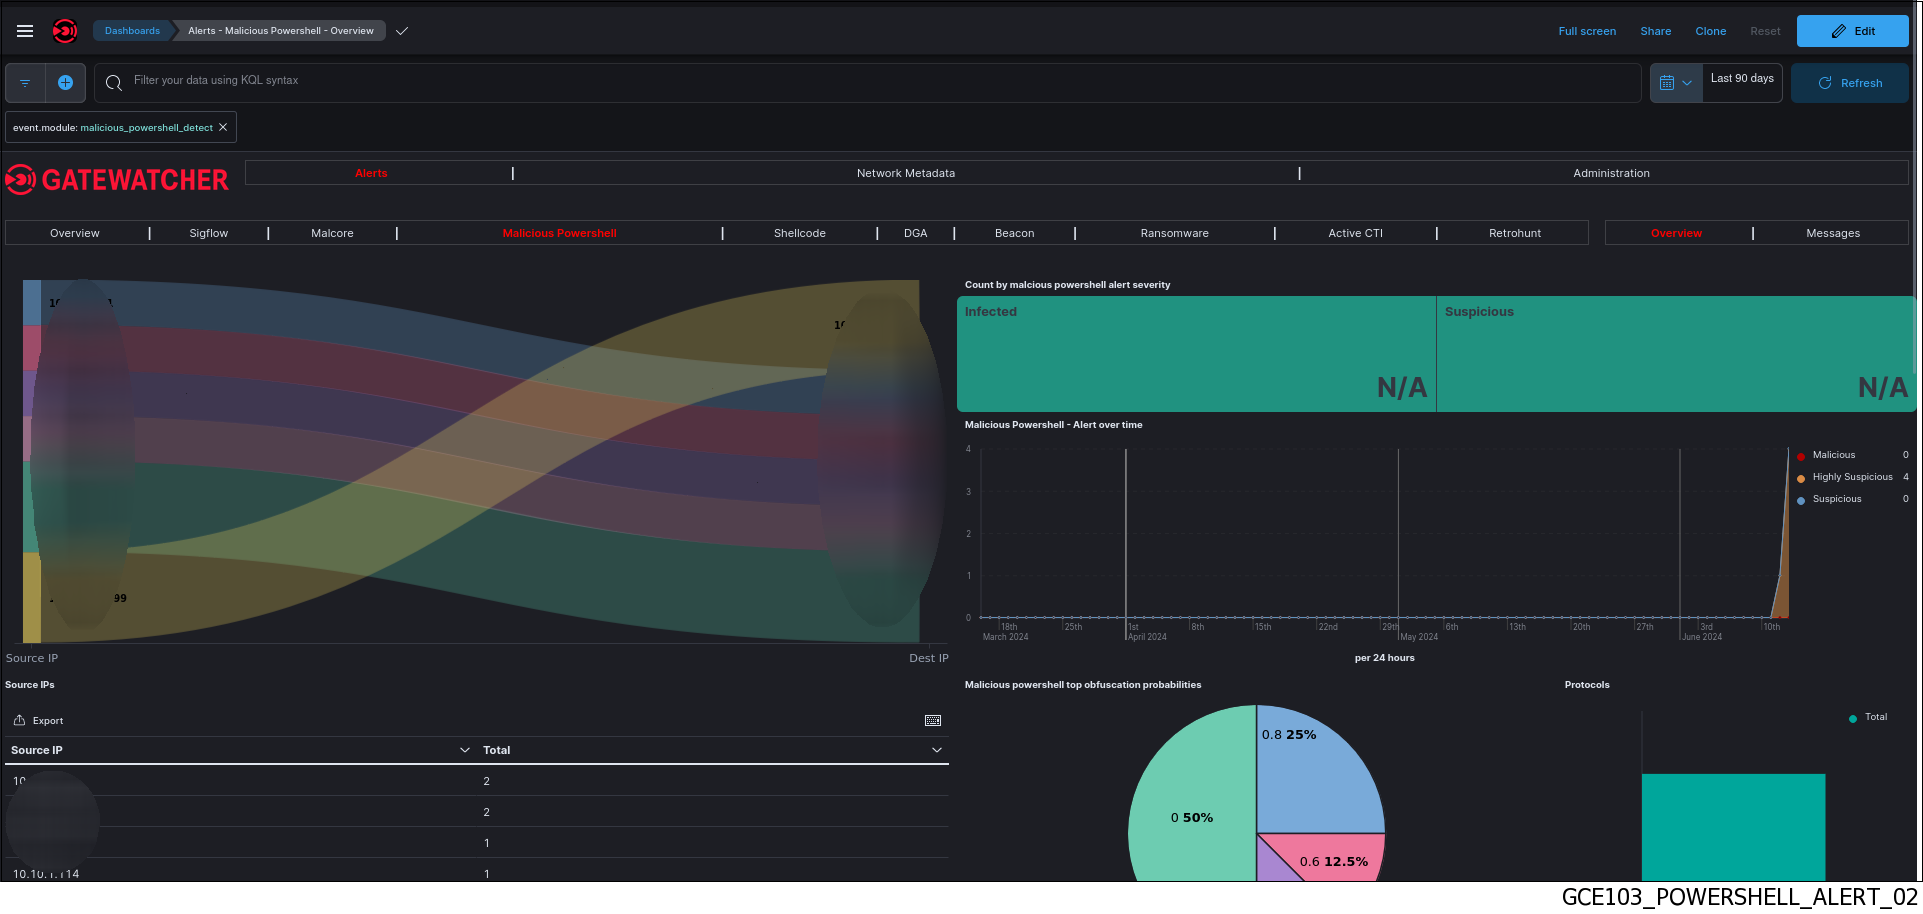 The interface displayed is the interface named Kibana UI (described in Overview of the Kibana GUI).
 Click on the
`Messages`tab (1).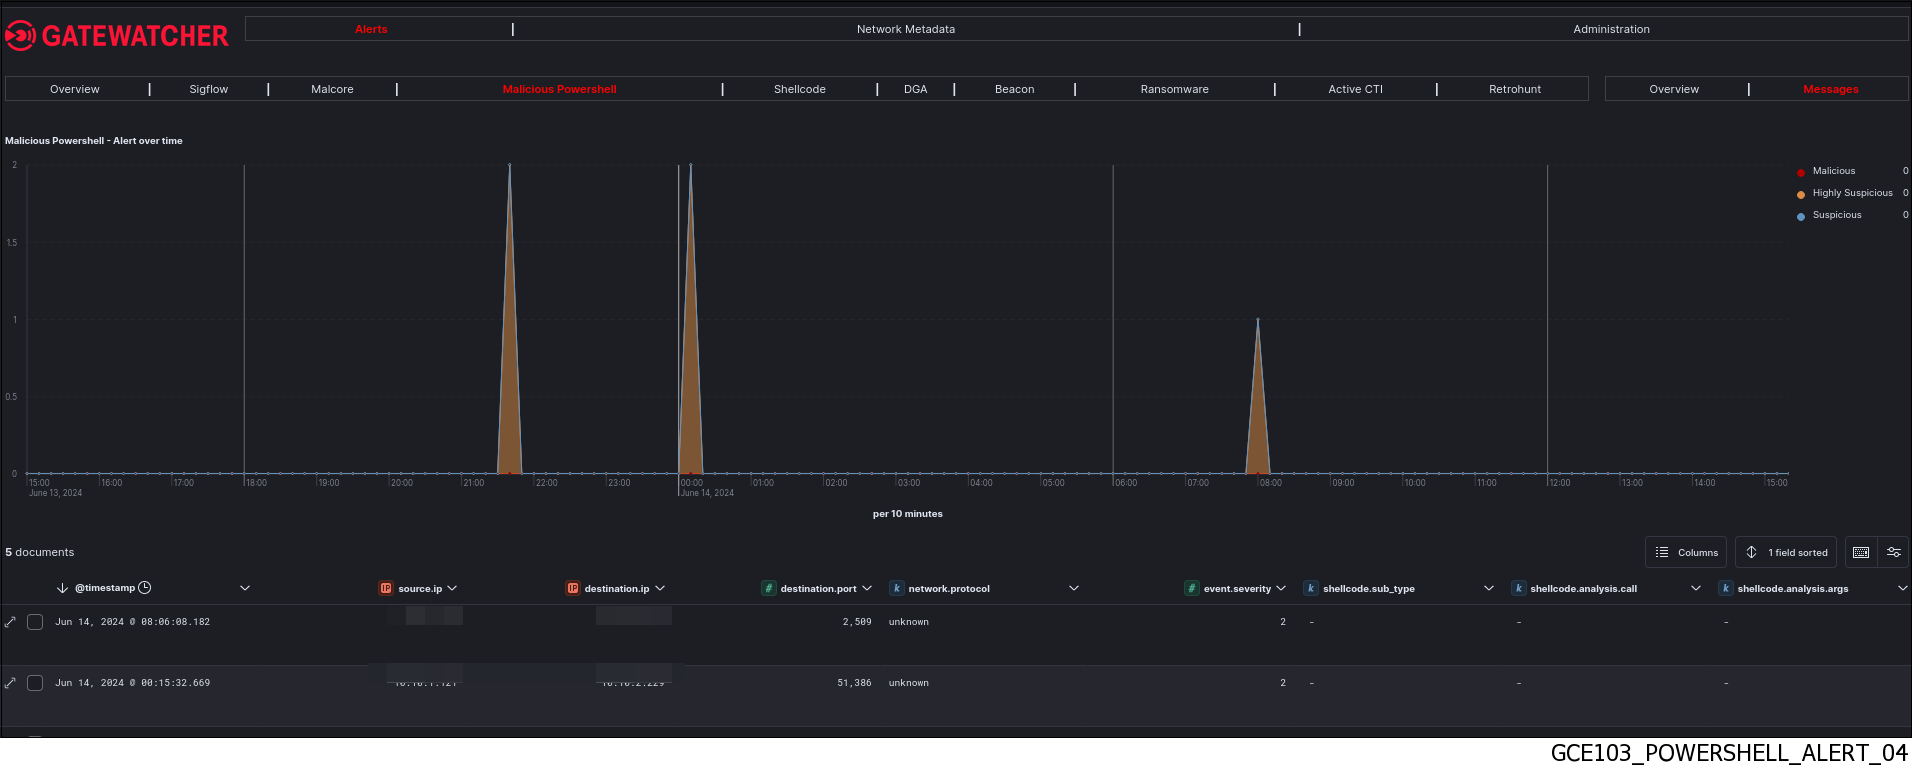
To consult information about a specific alert:
- Click on the toggle icon (1) on the left of the Alert.The expanded document (2) is displayed.
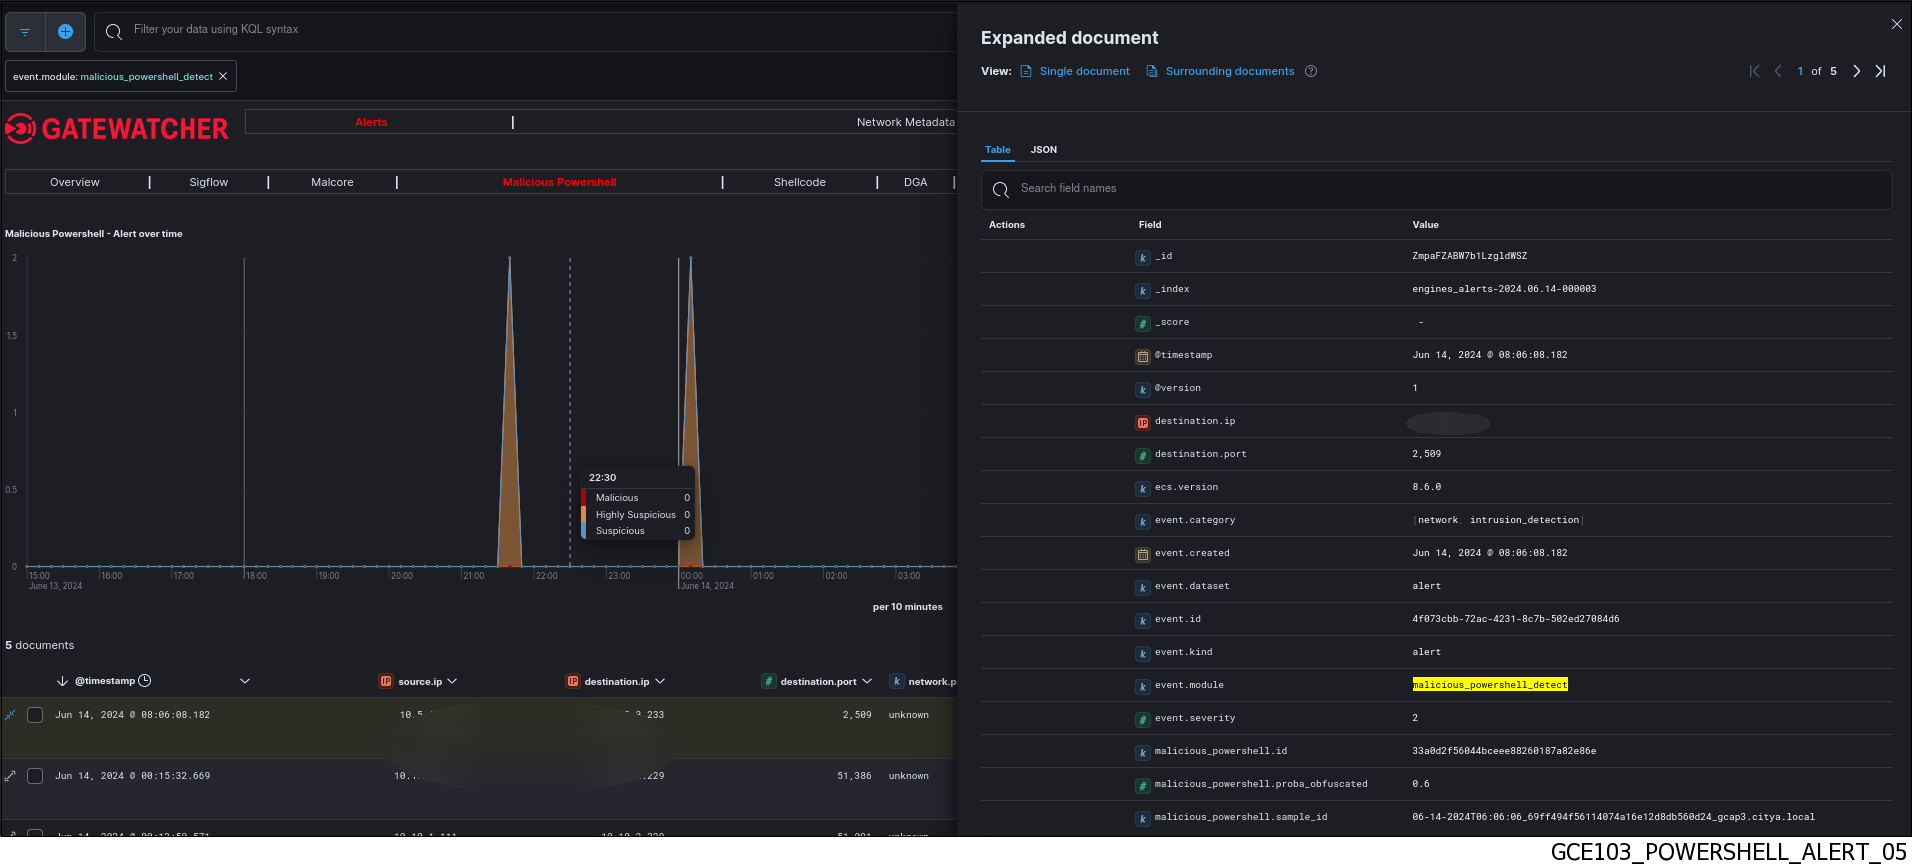 The detailed information of this alert can be viewed in table or json format (see the Malicious Powershell log data structure).The displayed counters are given in the Engine log data structure appendix.
Note
The Kibana UI can also be accessed without any filters via the
`Hunting`icon on the left side menu bar in the WebUI.
7.5.3.1.3. Essential information to understand the context of the alert
7.5.3.1.3.1. What are the key fields of an alert and their meaning?
`Alerts` view of the `WebUI`, when the selector `Group by name` is disabled:`Risk`The risk score of the alert, it depends on the success of the analysis of the Shellcode.`Date`(event.created)The date and time the alert was raised by the engine.`Name:`This is the threat description based on the analysis. It consists of:Malicious powershell detected, probably obfuscated (60b656e17bec0a97f5638790c78a3124)
- The alert severity:If the risk is 70% then the alert is indicated as
`Malicious`If the risk is 40% then the alert is indicated as`Suspicious` Engine name:
`powershell_detected`(event.module)The probability of obfuscation: if the score is superior to 0.75 then the
`probably obfuscated`information is displayedAn identifier based on the details of the analysis (malicious_powershell.id)
`Source IP`and`Dest. IP`(source.ip and destination.ip)The source and destination IP address associated with the alert.`Src. Host.`and`Dest. Host.`When the information is available, it is the name of the machines linked to the IP associated with the alert.
More information is available in the `Alert Details` panel by clicking on an alert:
In the
`Malicious Powershell Detect summary`section of the`Summary`tab:- Scores - Proba obfuscated (obfuscation probability:)This is the probability of obfuscation, a score of 1 indicates a high probability of obfuscation that can prevent the detection of suspicious commands.The more obfuscated the Powershell script, the more likely it is to be malicious.
- Scores - Analysis (score)This is the synthetic score of malice, a score greater than
`100`indicates the presence of several techniques considered malicious.
Click on the
`Details`tab (3).- Scores - Others (malicious_powershell.score_details)The score of the different techniques sought during the analysis, used to calculate the analysis score.
`event.severity`The threat score of the alert, it depends on the values malicious_powershell.proba_obfuscated and malicious_powershell.score.If these values are high enough, this score will have the value1, meaning a high probability of malice.If these values do not allow to decide on the threat, this score will have the value of2.`network.timestamp`The date and time the file was extracted by the GCap.`malicious_powershell.id`An identifier based on the analysis details, to group similar alerts.`malicious_powershell.sample_id`The unique identifier of the analyzed sample, composed of the extraction date, a random number, and the GCap name.
7.5.3.2. Alert handling procedure
7.5.3.2.1. How do you verify the accuracy of an alert and determine if it represents a real threat?
- Check sample content: legitimate toolSometimes legitimate Powershell code is confused with malicious code.A number of tools are installed using Powershell commands as malware might do.For example, chocolatey, a package manager for windows, installs with the following command.iex ((New-Object System.Net.WebClient).DownloadString('https://community.chocolatey.org/install.ps1')This kind of command is often used in a malicious framework to download in memory and run malware on a Windows machine.The only clue to conclude a legitimate order is the url, by performing a search on the Internet.This is usually easy to identify:
On the WebUI interface, open a Malicious Powershell alert.
Click on the
`Show Hexdump`command of the`Action`menu.Search the right column for keywords known as legitimate tools.
Search the right column for any suspicious content.
If in doubt, contact administrators for confirmation.
- Check sample content: Antiviral DBThe malicious_powershell engine often categorizes anti-viral database update streams, or similar, as malicious over the network.These feeds contain signatures that can trigger an alert, but they also contain the names of these signatures.It is therefore generally easy to identify them:
On the WebUI interface, open a Malicious Powershell alert.
Click on the
`Show Hexdump`command of the`Action`menu.Search the right column for keywords similar to signature names.
If enough (3-4) different keywords are identified, it is certainly an antiviral database
Names can be truncated depending on the type of stream being extracted.Generally, just search for keywords on Microsoft’s website: https://www.microsoft.com/en-us/wdsi/threatsExamples:Pshdlexec ("TrojanDownloader:X97M/Pshdlexec")
!##..32/Hikiti.GIC ("Backdoor:Win32/Hikiti")
...64/Meterpreter.R ("Trojan:Win64/Meterpreter")
Y2V:Costin_Raiu_Kaspersky_Lab/loki2crypto
- Check flow type: BackupIt is possible for a malicious Powershell script to be detected in a virtual machine backup stream.This means that there is a malicious Powershell on the machine disk.This is an alert that is less urgent to investigate and will depend on the use of this machine.For example, a cybersecurity expert could keep such files on his machine.To know if it is a backup flow, we can:
Compare ports (source.port, destination.port) with your virtualization tool documentation
Check if the IP matches a storage server
Check if many similar flows occur at the same time
Contact the infrastructure staff
7.5.3.2.2. How to categorize the threat based on the information collected?
- Check the target machine.Powershell scripts require the Powershell interpreter to be installed on the machine, which is still the case on Windows, but very rare for Linux or MacOS.In addition, the capabilities of the Powershell framework are limited for them, reducing its interest in a malicious framework.Thus, when a Malicious Powershell alert is raised, it is interesting to check that the target machine is indeed under Windows.If so, it is likely that the machine has been infected.If not, it may be a intermediate machine or a false positive.
- Check detailed scores in alert.In the alert, consult the list of detailed analysis scores to determine the actions taken by the
`powershell`code.The`malicious_powershell.score_details`subfields indicate the score related to the types of commands detected.Obfuscation techniques detected:`FmtStr`Reassembly of multiple values into a formatted string`StrCat`Concatenation of multiple strings`StrJoin`Concatenating multiple strings with`-join``CharInt`Creating characters from integers with``[Char]``Base64`Presence of Base64 encoded strings`StrReplace`Changing strings by replacing patterns
Detected commands related to the download:`WebClientInvokation``InvokeWebRequest``InvokeRestMethod``StartBitsTransfer`
Detected commands related to file interaction:`GetContent``SetContent``AddContent``StreamReader``StreamWriter``SystemIOFile`
Detected commands related to order execution:`InvokeExpression`
Thus, we can deduce behaviors from this information.For example an alert with the following results:`malicious_powershell.score_details.InvokeExpression: 50``malicious_powershell.score_details.InvokeWebRequest: 20`
Indicates a download and execution of`powershell`code as a`string`.This is probably a dropper that downloads code to run. - Manually analyze the Powershell scriptIt is often useful and effective to access the sample content to view the detected powershell code and categorize the threat.
On the WebUI interface, open a Malicious Powershell alert.
Click on the
`Show Hexdump`command of the`Action`menu.Identify the Powershell code detected by a
`powershell`text search.- Extract script manually for better reading.Typically, the powershell code is intercepted as one or more orders placed directly to the powershell.In this case, isolate the code after the
`-Command`or`-c`argument.It is not uncommon for the script to be partial, "perforated", or strewn with non-printable characters due to various network-related factors.The powershell code may also have been intercepted in base64.In this case, the base64 character string containing the code located after the`-EncodedCommand`or`-e`and extract it.This tool can be used: CyberChef - getEncodedCommandIf the`powershell`code was intercepted as a . ps1 file, the code should be readable and isolated without further action. - Read code to understand purposeThe Powershell language is relatively intuitive to read with basic programming, if it is not too obfuscated.The purpose of this first reading is to identify interesting commands like those indicated in the previous section.We can also be interested in external commands or windows executables, for example:
`regedit.exe`: import/export registry keys`reg add`: add a registry key`schtasks /Create`: create a scheduled task`net start/stop`: starts/stops a service`wmic`: obtaining or changing the configuration of a remote machine`netsh advfirewall`: obtaining or changing firewall configuration`wusa /kb:{numero}`: uninstall package by KB number
Help can usually be found to understand these commands on the Internet.Overall, these commands can identify whether the script looks malicious or legitimate.If the code is too difficult to understand, it is possible to use an AI (eg chatGPT, Mistral, Phind, etc.) provided that the extraction is of good enough quality. Look for information that may contain indicators of compromise or threat details such as:
URLs (e.g. search
`http://`)IP addresses
File paths (e.g., search for
`c:\`,`%AppData%`or`%windir%`)Registry key paths (e.g. search
`HKLM`,`HKCU`,`CurrentVersion`)Messages to the victim (e.g. “Your sensitive data has been stolen”)
It is common for this information to be obfuscated in order to avoid pattern detection.Here are the main techniques encountered along with tools to solve them:simple concatenation:
`"abc"+"def"`(recette CyberChef strcat) ou("abc", "def") -join ""(recette CyberChef strjoin)- base64:
`WW91ciBkYXRhIGhhcyBiZWVuIHN0b2xlbg==`(recette CyberChef base64)This tool extracts only the viewable text, if the base64 starts withTVqQit is probably a windows executable. complex concatenation:
`([char]0x61,[char]0x62,[char]0x63,[char]0x64,[char]0x65,[char]0x66) -join ""`(recette CyberChef charint)search-replace:
`"aXzYZf" -replace "XzYZ", "bcde"`(recette CyberChef strReplace)format string:
`"{1}{2}{0}" -f "ef","ab","cd"`
Most`string`obfuscation techniques are easy to undo with the right recipe`CyberChef`When CyberChef or similar tools are not enough, it is possible to use an AI (eg chatGPT, Mistral, Phind, etc.) in order to obtain the obfuscated code.As a last resort, be careful to copy only the obfuscation code, execute the obfuscation code snippet in a`powershell`interpreter.This`powershell`interpreter must have as few rights as possible to limit the risks in case of false manipulation.PS C: Users Guest> "aXzYZf" -replace "XzYZ", "bcde" -> abcdef - Correlate with other enginesIt is interesting to check the presence of alerts from other engines from information identified by Malicious Powershell Detect.
IP Source:
`x.y.z.1`IP Destination:
`x.y.z.2`URL or IP contacted by the script
File downloaded by script
`Alerts`menu of the WebUI, select all engines except Malicious Powershell Detect and filter on the collected information.Some examples of filters:
Filter 1:
`ip:x.y.z.1`Filter 2:
`ip:x.y.z.2`Note
It is important to note that the source IP identified by Malicious Powershell Detect may have been identified by another engine as an IP Destination.
The most suspicious alerts will be related to the compromise of the source IP: executable files, privilege elevation, connection to bad reputation IPs among others.
`source.ip:x.y.z.1 or destination.ip:x.y.z.2) and event.module:"sigflow_alert"`
`source.ip:x.y.z.1 or destination.ip:x.y.z.2) and event.module:"sigflow_alert"`
Correlate with windows logs
If a malicious Powershell script was run on a Windows machine, there is a good chance of finding a trace of it in the event logs.
- If the feature is enabled, Windows records all executed powershell commands.To do this, open "Event Viewer", then go to "Application and Service Logs", "Microsoft", "Windows", "Powershell".
7.5.3.2.3. What answers are needed if the threat is confirmed?
Isolate the system: immediately isolate the contaminated system and ensure it cannot cause further damage.
Notify: inform relevant parties of threat detection.
Collect information: gather critical information such as IP addresses, or information in the Hexdump.
Neutralize the threat by blocking the IP address.
Analyze logs: review system and network logs to trace the spread of the threat.
7.5.3.2.4. What if an alert from this engine is identified as a false positive?
`mute` the alert signed.