5. Using a NETDATA server
This guide provides an overview of the steps required to set up a netdata monitoring server and its interconnection to a GCenter in order to ensure its monitoring.
Note
The Netdata version compatible with GCenter and GCap is 1.19
5.1. Installation via docker
Install the netdata docker
docker pull netdata/netdata:v1.19.0
To be able to edit the netdata configuration from the host machine, a temporary container must be launched to retrieve the configuration files.
mkdir netdataconfig
docker run -d --name netdata_tmp netdata/netdata
docker cp netdata_tmp:/usr/lib/netdata netdataconfig/
docker rm -f netdata_tmp
Launch of the final container
docker run -d --name=netdata \
  -p 19999:19999 \
  -v $(pwd)/netdataconfig/netdata:/usr/lib/netdata:rw \
  -v netdatalib:/var/lib/netdata \
  -v netdatacache:/var/cache/netdata \
  -v /etc/passwd:/host/etc/passwd:ro \
  -v /etc/group:/host/etc/group:ro \
  -v /proc:/host/proc:ro \
  -v /sys:/host/sys:ro \
  -v /etc/os-release:/host/etc/os-release:ro \
  --restart unless-stopped \
  --cap-add SYS_PTRACE \
  --security-opt apparmor=unconfined \
  netdata/netdata
5.2. Configuration
Stream.conf and gcenter configuration
Generate uuid
sudo docker exec -it netdata uuidgen
Stream configuration with the previously generated uuid.
Netdata recommends using edit-config
sudo docker exec -it netdata /etc/netdata/edit-config stream.conf
[dd236090-a42d-43e2-b0ba-ff8eaa6216a2] << Replace the uuid here
    enabled = yes
    default history = 36000
    default memory mode = ram
    health enabled by default = auto
    allow from = *
    default postpone alarms on connect seconds = 60
Configuring the netdata.conf
sudo docker exec -it netdata /etc/netdata/edit-config netdata.conf
[global]
      ...
      hostname = netdata-docker.gatewatcher.com
      ...
      timezone = Europe/Paris
Configuring netdata export in gcenter
Note
Read: ref:monitoring:Netdata Export.
For netdata to send notifications, health_alarm_notify.conf must be configured
sudo docker exec -it netdata /etc/netdata/edit-config health_alarm_notify.conf
Reference: Alarm Configuration
5.3. Creating alerts for Netdata
Alerts are created in the container folder:
/usr/lib/netdata/conf.d/health.d
In order for the new alerts to be taken into account, it is necessary to restart the docker container.
To facilitate managing the alerts, it is advisable to create a *.conf file for each category of alert.
Here are a few examples:
Description |
Link |
|
|---|---|---|
Alert in case of a lack of or overload of traffic |
||
Alert if Gcap analysis services are disabled |
||
Alert if a Gcap/Gcenter restart has taken place |
||
RAM overload alert |
||
Alert for "dropped" network packets on Gcap |
||
Alert in case of disk filling, here the data partition of Gcap |
||
CPU overload alert |
||
Create your own alerts
Alert creation is based on the metrics collected by netdata.
To find out what these metrics are, log in to the netdata interface of your Gcenter.
https:// IP or FQDN of Gcenter /gstats
Taking the example of RAM monitoring
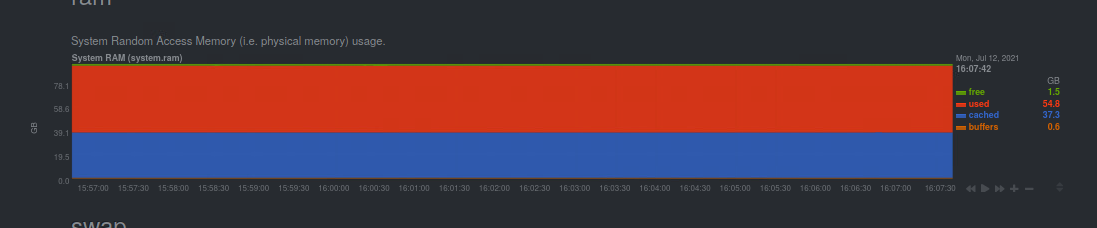
The name of the Graph is system.ram and the curve to monitor used
The alert in ram.conf will be written as follows:
We name the alarm
1>> alarm: ram_usage
The chart in Netdata is called:
2>> on: system.ram
It is indicated that the 10 min average of the used curve is calculated
3>> lookup: average -10m percentage of used
The unit is specified
4>> units: %
The time interval between each calculation is defined.
5>> every: 1m
Alert and critical thresholds are defined
6>> warn: $this > 70
7>> crit: $this > 90
The delay time for the alarm to be cancelled after triggering is defined.
8>> delay: down 15m multiplier 1.5 max 1h
Description of the alarm
9>> info: average RAM utilisation over the last 10 minutes
Define who will be alerted (see health_alarm_notify.conf)
10>> to: sysadmin