1. Home Page

Menu: Home Page
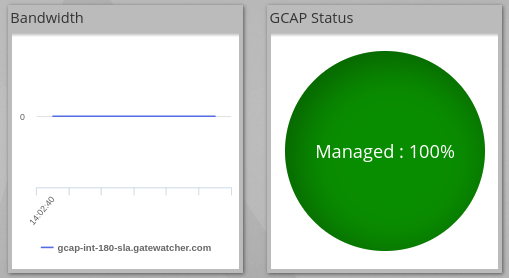
A quick view of the solution's status is available directly from the Home Page. This page can be accessed at any time by clicking on the Gatewatcher logo located in the left menu.
It displays the overall status of the TRACKWATCH solution as well as the files awaiting analysis. Further down the page, GCAP status and update information is also available.


Menu: Home Page
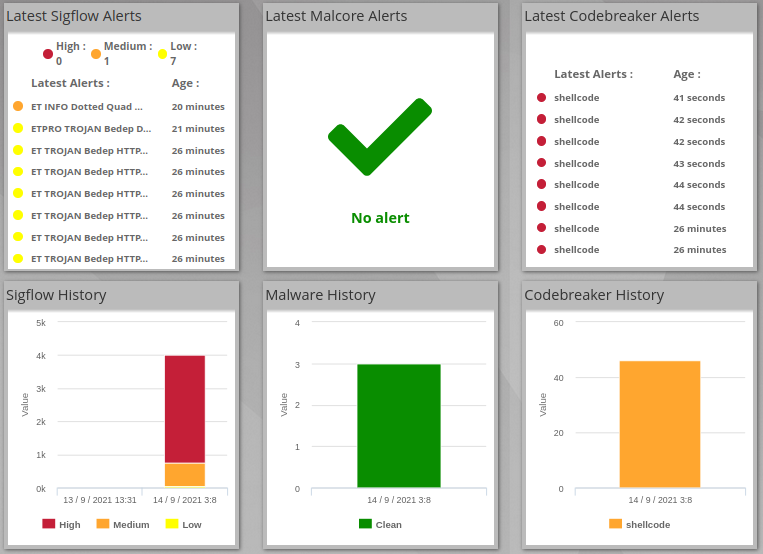
As an operator, the Home Page content will be different. A summary of the latest alerts will be shown.
2. Embedded Dashboards
Menu: Administrators > GCenter > Monitor
From this section, TRACKWATCH administrators are allowed to view real-time information pertaining to the devices.
This interface is used to monitor the GCenter in terms of CPU, memory, network, and disk load via dynamic dashboards.
The GATEWATCHER administrator can access information on the monitored services to ensure they are functioning properly:
Basic host stats
Malcore stats
Malcore database stats
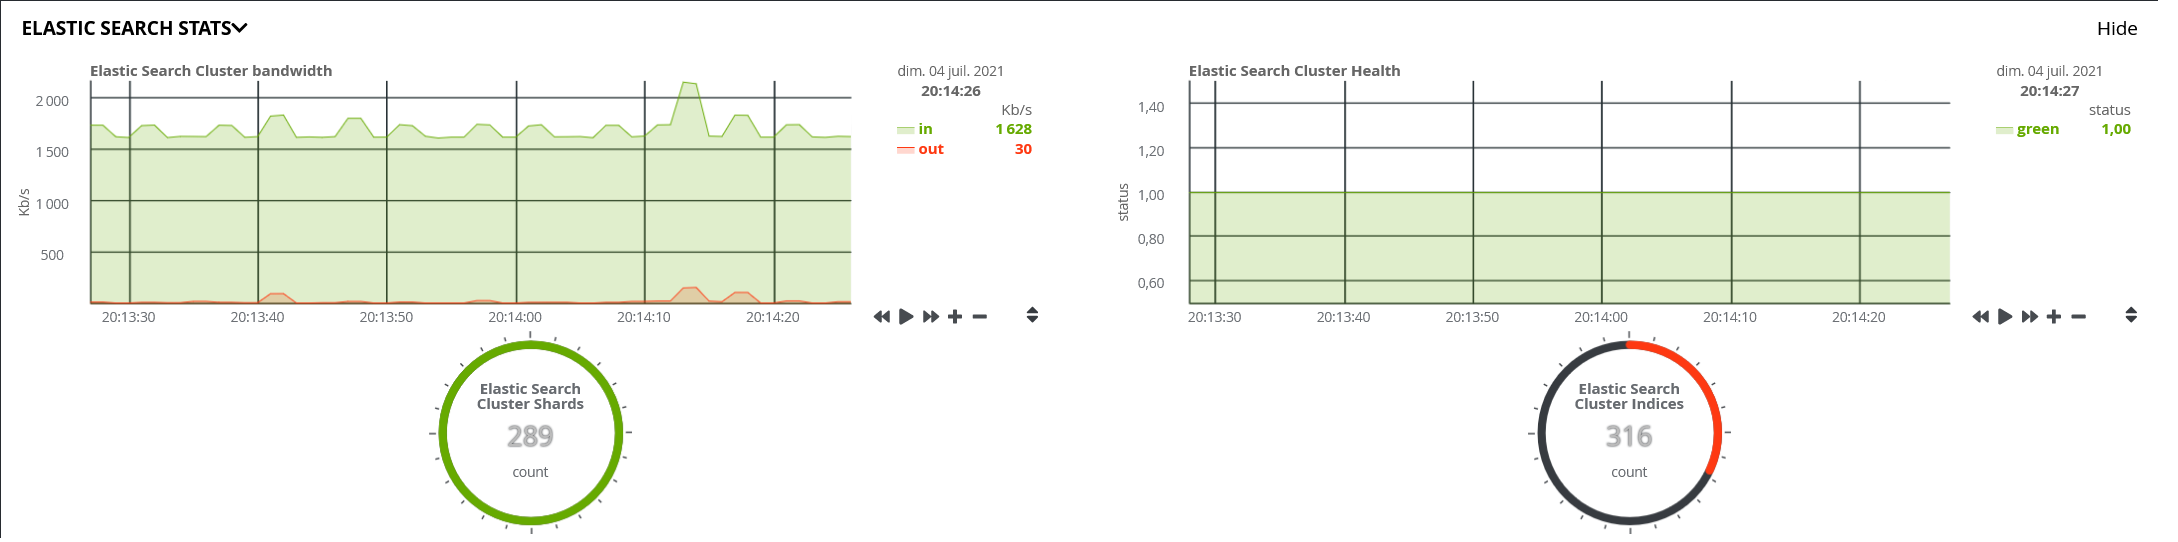
Elastic search stats
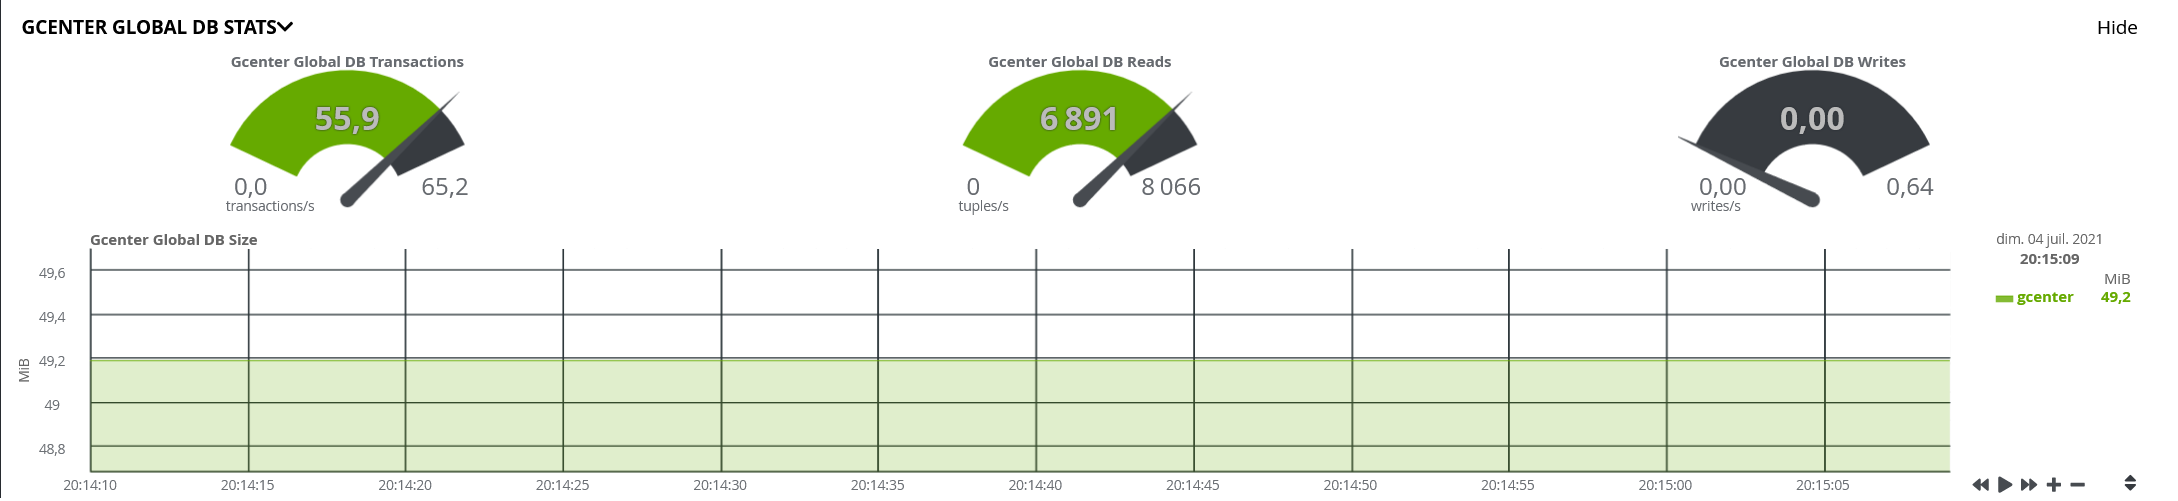
GCENTER global db stats
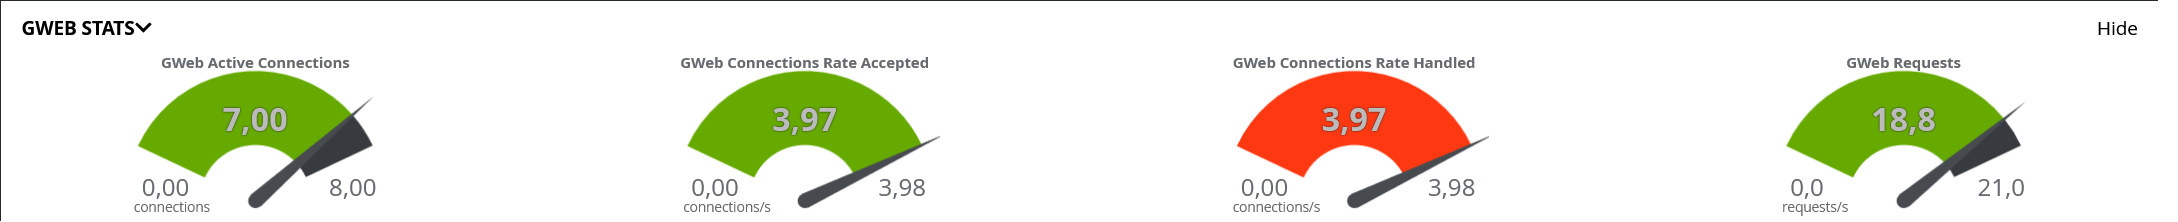
Gweb stats
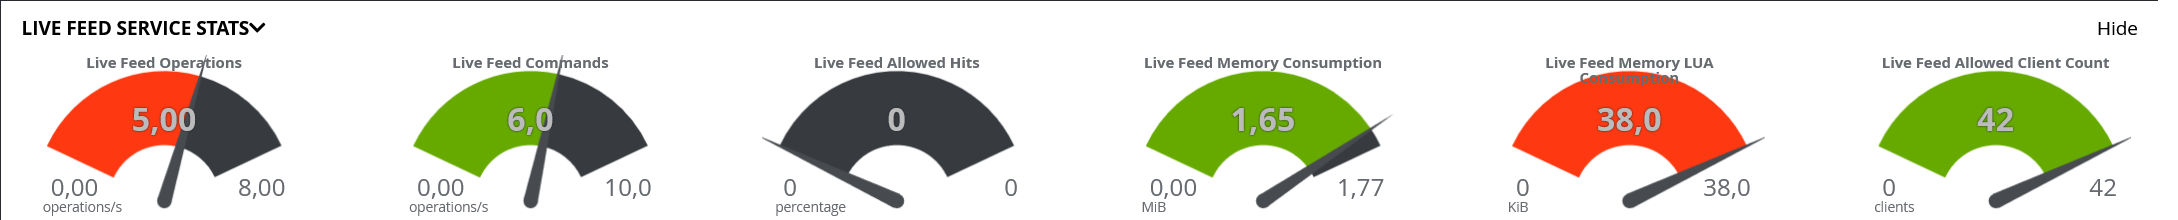
Live feed service stats
Network stats
The Basic host stats section appears by default. The other sections are visible by clicking on the section name or the Show button.
It is possible to hover over the charts to view the measured values. On charts with several plotted values, it is also possible to choose which element will be plotted by clicking on the legend to show or hide them.
In addition, depending on the position of the mouse cursor on any chart, the position on the other charts is also synchronised. This enables you to access all the necessary information at a given time T.
 Enables you to move over the chart to the left. This manipulation is possible thanks to a drag to the right with the mouse.
 Enables you to move over the chart to the right. This manipulation is possible thanks to a drag to the left with the mouse.
 Enables all charts to be reset to their default auto-refresh setting. The administrator can also double-click on the content of the chart with his mouse.
 It is possible to zoom into the chart or press Shift and select the area of the chart to zoom in. Zooming is also possible by pressing Shift or Ctrl with the mouse wheel.
 The administrator can drag with the mouse, using this feature to change the chart vertically. It is possible to double-click to reset between two statuses, the default chart and the one that corresponds to all values.
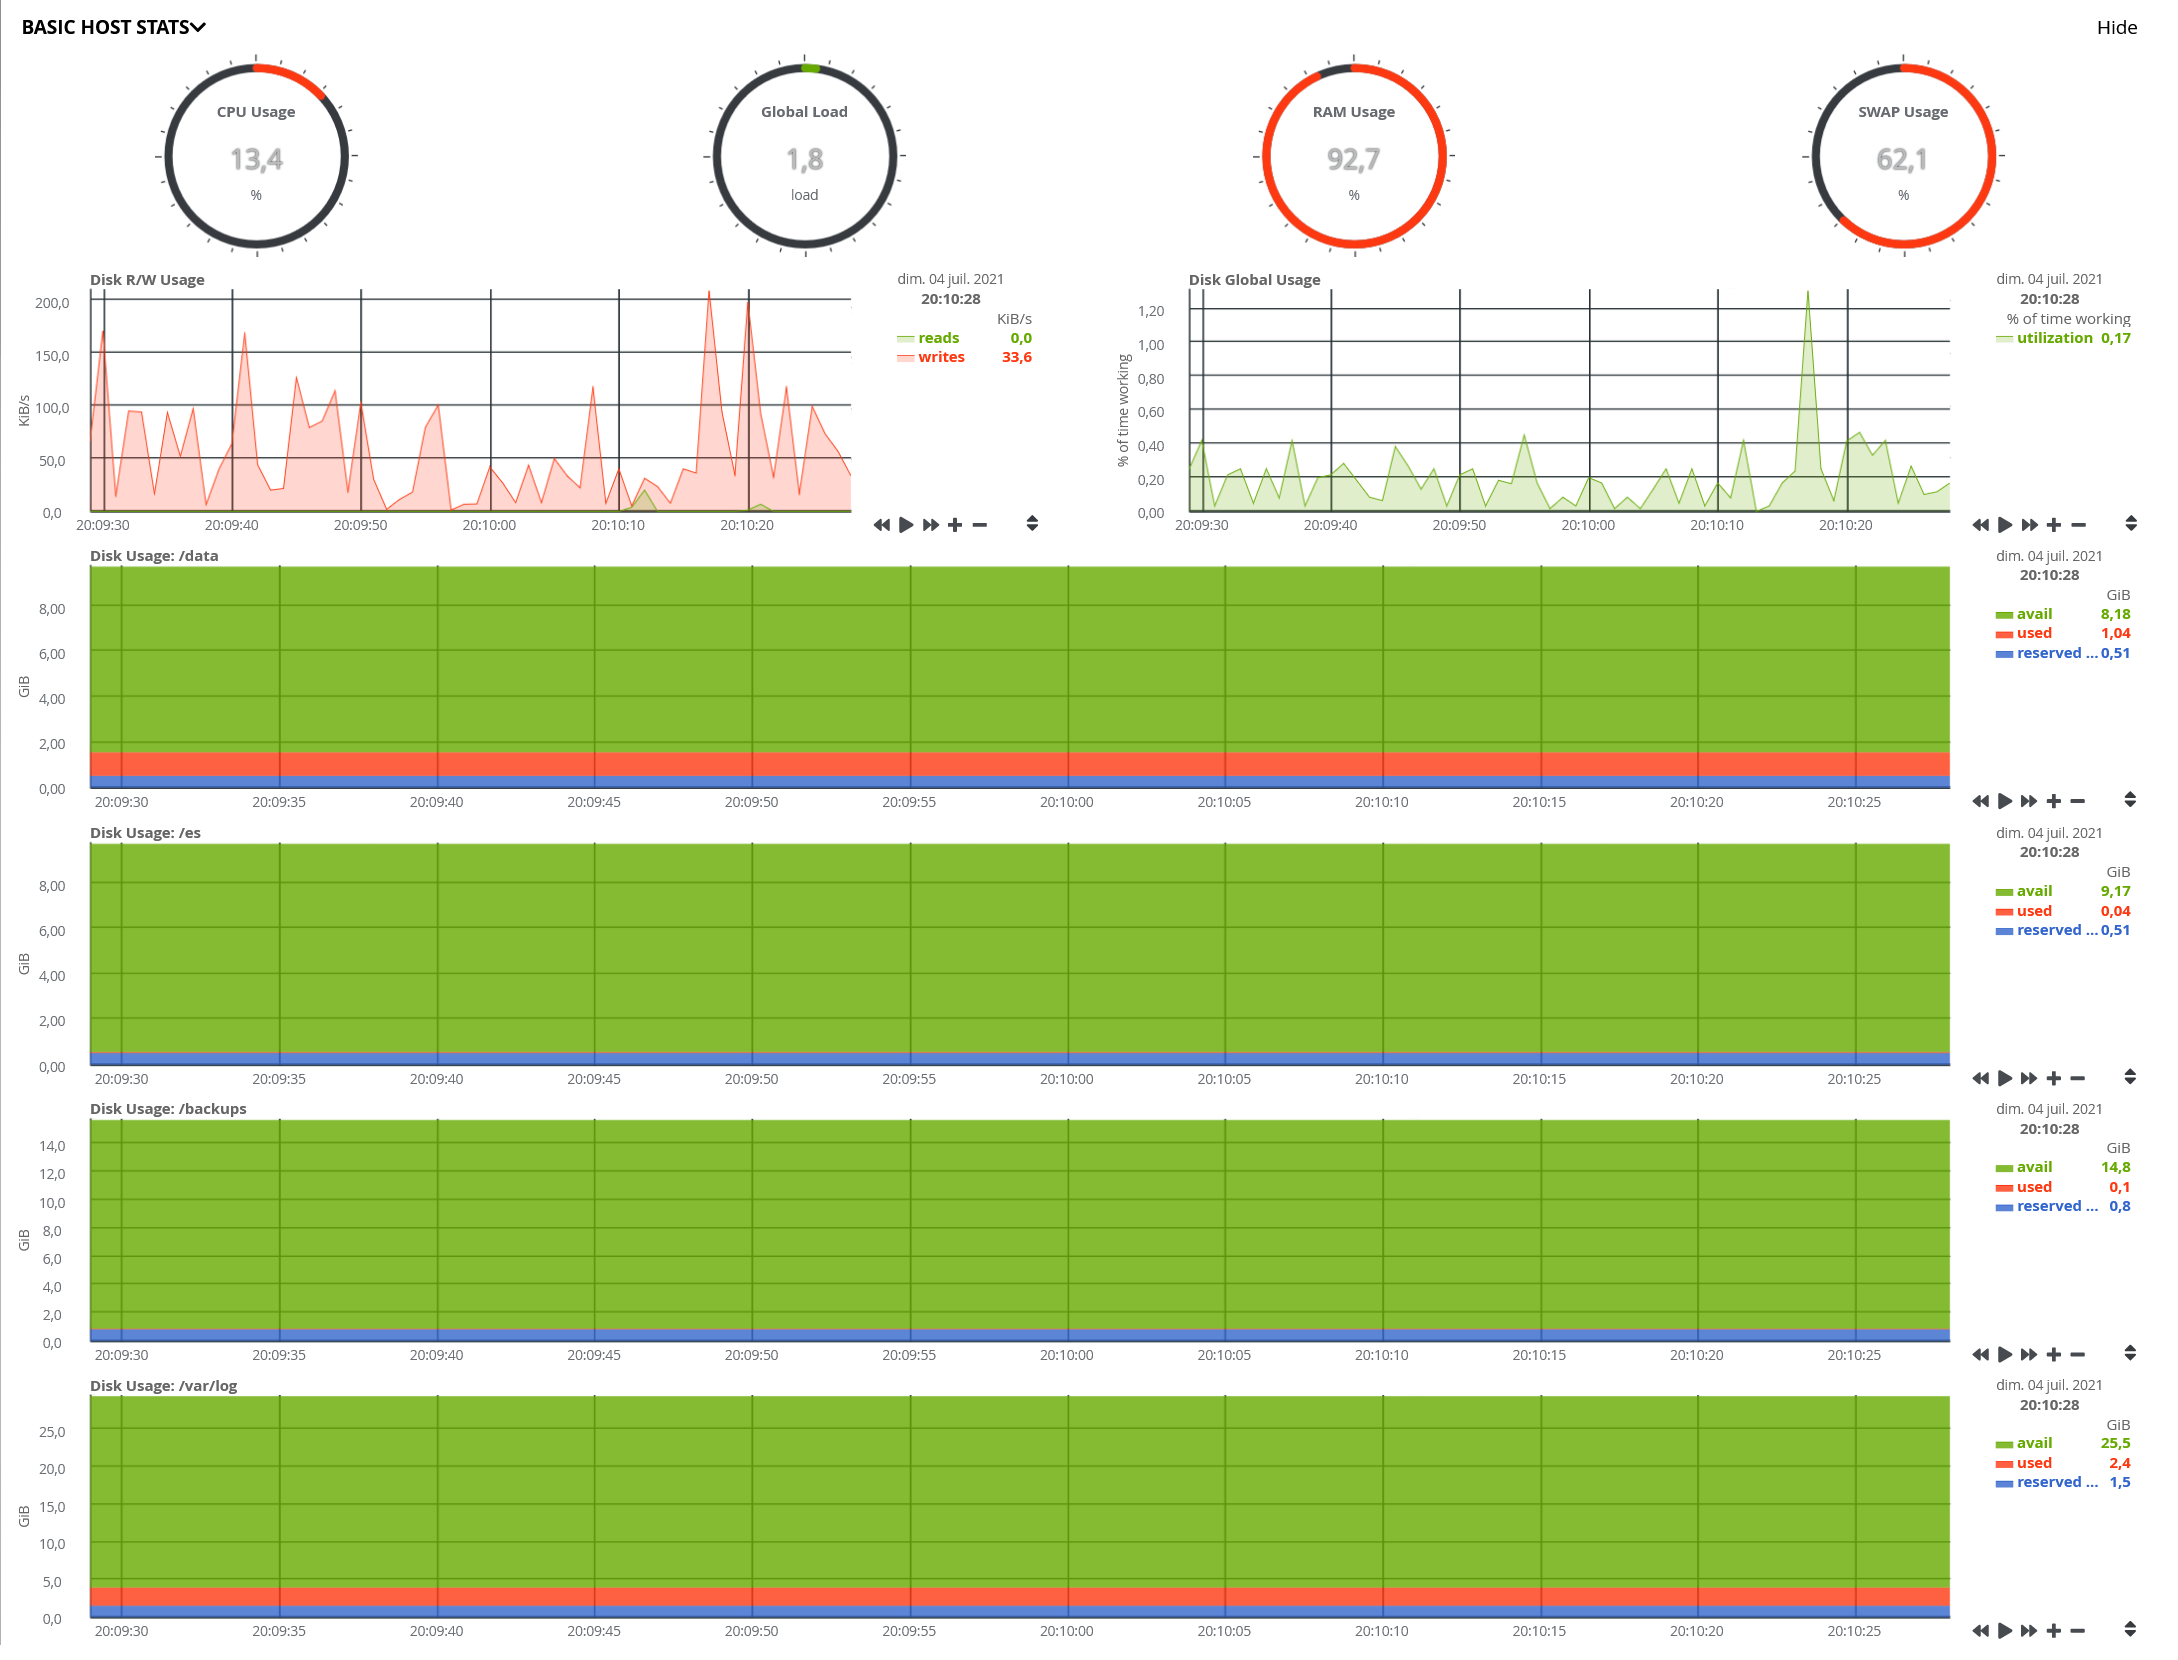
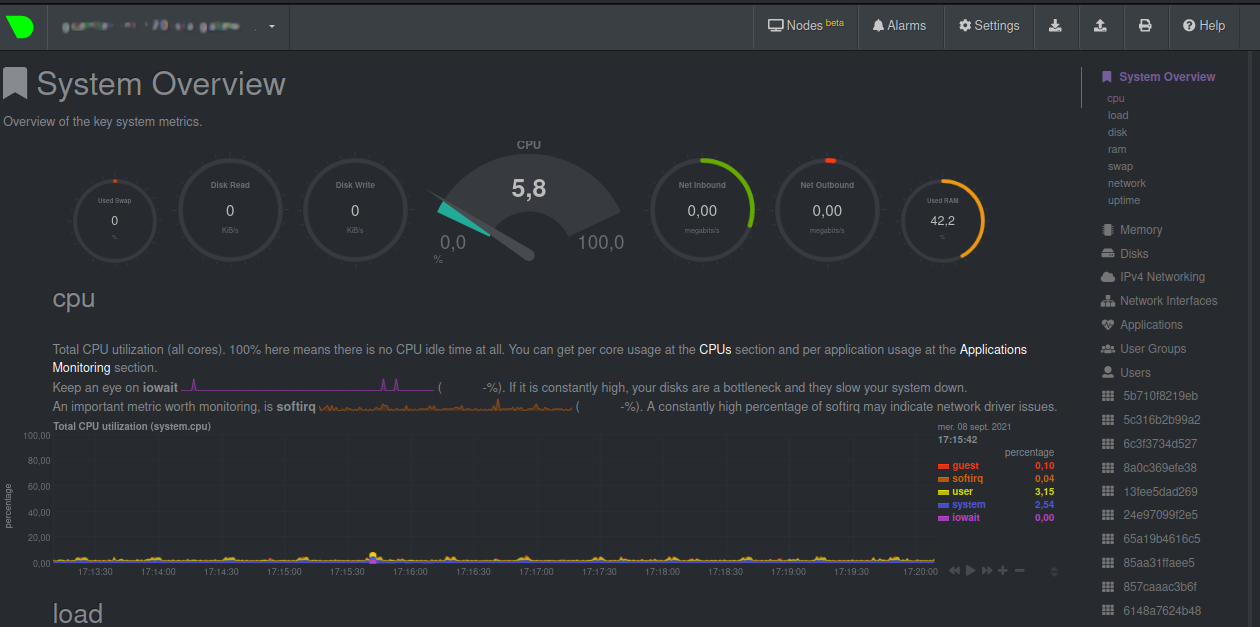
BASIC HOST STATS provides real-time information from the GCENTER with overall system indicators such as average CPU occupancy rate, disk writes, and swap occupancy rate. Used, free, and reserved capacity for individual directories are also monitored.
MALCORE STATS provides status information in terms of used CPU, RAM, and SWAP capacity for the MALCORE engine.

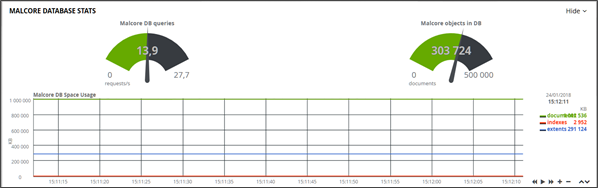
MALCORE DATABASE STATS provides statistical information pertaining to the MALCORE Engine database.
ELASTIC SEARCH STATS provides information on the status of the ElasticSearch cluster. This is responsible for recording and then indexing the data captured by the GCAP probe in the GCENTER. The cluster bandwidth is monitored.
GCENTER GLOBAL DB STATS provides information on how much the GCENTER global database is consuming.
GWEB STATS provides information regarding the GCENTER's Nginx web server.
LIVE FEED SERVICE STATS provides information on all the services comprising the GCENTER.
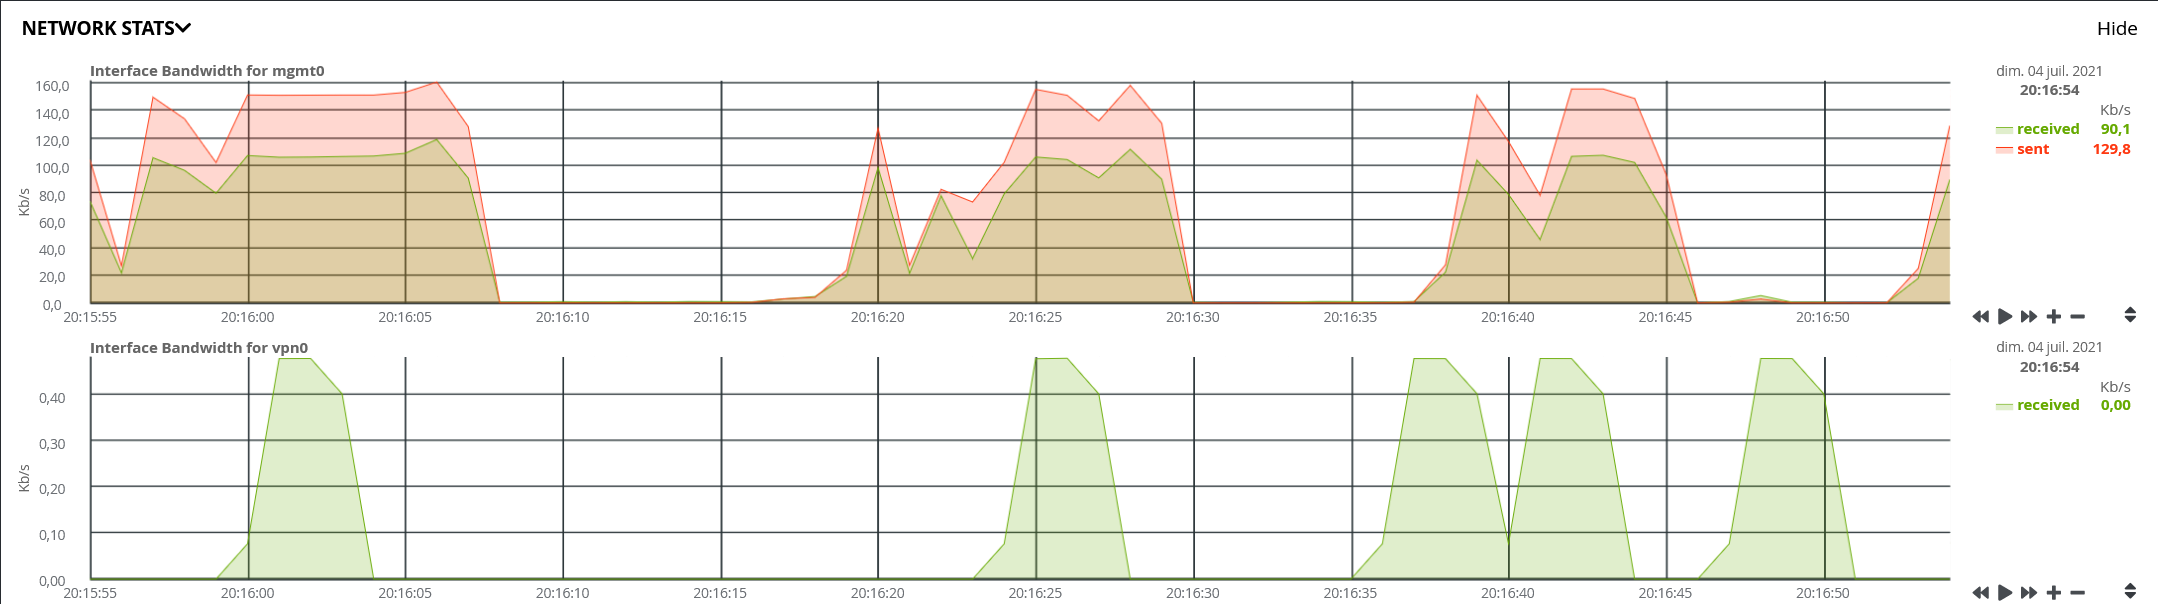
NETWORK STATS provides information on the network interfaces bandwidth connected to the GCENTER. The more physical interfaces connected to the equipment, the more tables there will be.
3. Nagios
Menu: Administrators > GCenter > Configuration > Nagios
 It is thus possible to expose various metrics on a given port in order for the Gcenter to be overseen by a monitoring system such as Nagios, Centreon, Zabbix, or others.
First of all, the service must be activated.
Enable Nagios: allows a third-party server to request metrics regarding the gcenter's operation.
Listening port: is the monitoring interface on which the metrics will be displayed.
Input interface: is the interface on which the GCENTER will be listening.

The following fields enable listing the networks authorised to contact the supervision server (IP address in the form xxx.xxx.xxx.xxx) and the associated subnet mask (from 0 to 32).
It is thus possible to display a certain number of metrics on a given port in order for it to be polled by a monitoring system such as Nagios, Centreon, or Zabbix, etc.
First of all, the service must be activated.
Enable Nagios allows activating the monitoring via a polling system.
Listening port: is the monitoring interface on which the metrics will be displayed.
Input interface: is the interface on which the GCENTER will be listening.
The following fields enable listing the IP addresses or networks authorised to contact the supervision server. An IP address, in the form xxx.xxx.xxx.xxx , must be entered in the IP address field. The subnet mask must be selected with a value in the Subnet mask field ranging from 0 to 32.
Once these values are entered, the administrator can register the addition of the servers by pressing Save.
Once this is accomplished, the following endpoints will be made available to the monitoring servers
| Metric | Endpoint |
|---|---|
| GCenter | http://<addresse du gcenter>:<port d'écoute>/host/<fqdn du gcenter>/api/v1/allmetrics |
| GCAP | http://<addresse du gcenter>:<port d'écoute>/host/<fqdn du gcap>/api/v1/allmetrics |
4. Netdata
Address: https://ip.du.gcenter/gstats
A Netdata server is also embedded in the TRACKWATCH solution.
This server is accessible to administrators via the URL https://ip.du.gcenter/gstats.
This interface provides administrators with a wide range of metrics on the various devices in the TRACKWATCH solution.
Via the menu at the top of the page it is possible to select the equipment to be observed. The GCenter will be found there, as well as the GCap that are paired with it.
Alternatively, this data can also be viewed from the kibana Netdata dashboard accessible from the Operators > Dashboards menu.

4.1. Netdata export
Address: ADMINISTRATORS > GCenter > Configuration > Netdata Export
Although the TRACKWATCH solution includes a Netdata server, the administrator may want to export the real-time system data to an existing Netdata server.
In order for the TRACKWATCH solution to communicate its information to a Netdata server, this section must be configured with the necessary information. This configuration is carried out from two tabs:
4.1.1. Netdata - General settings
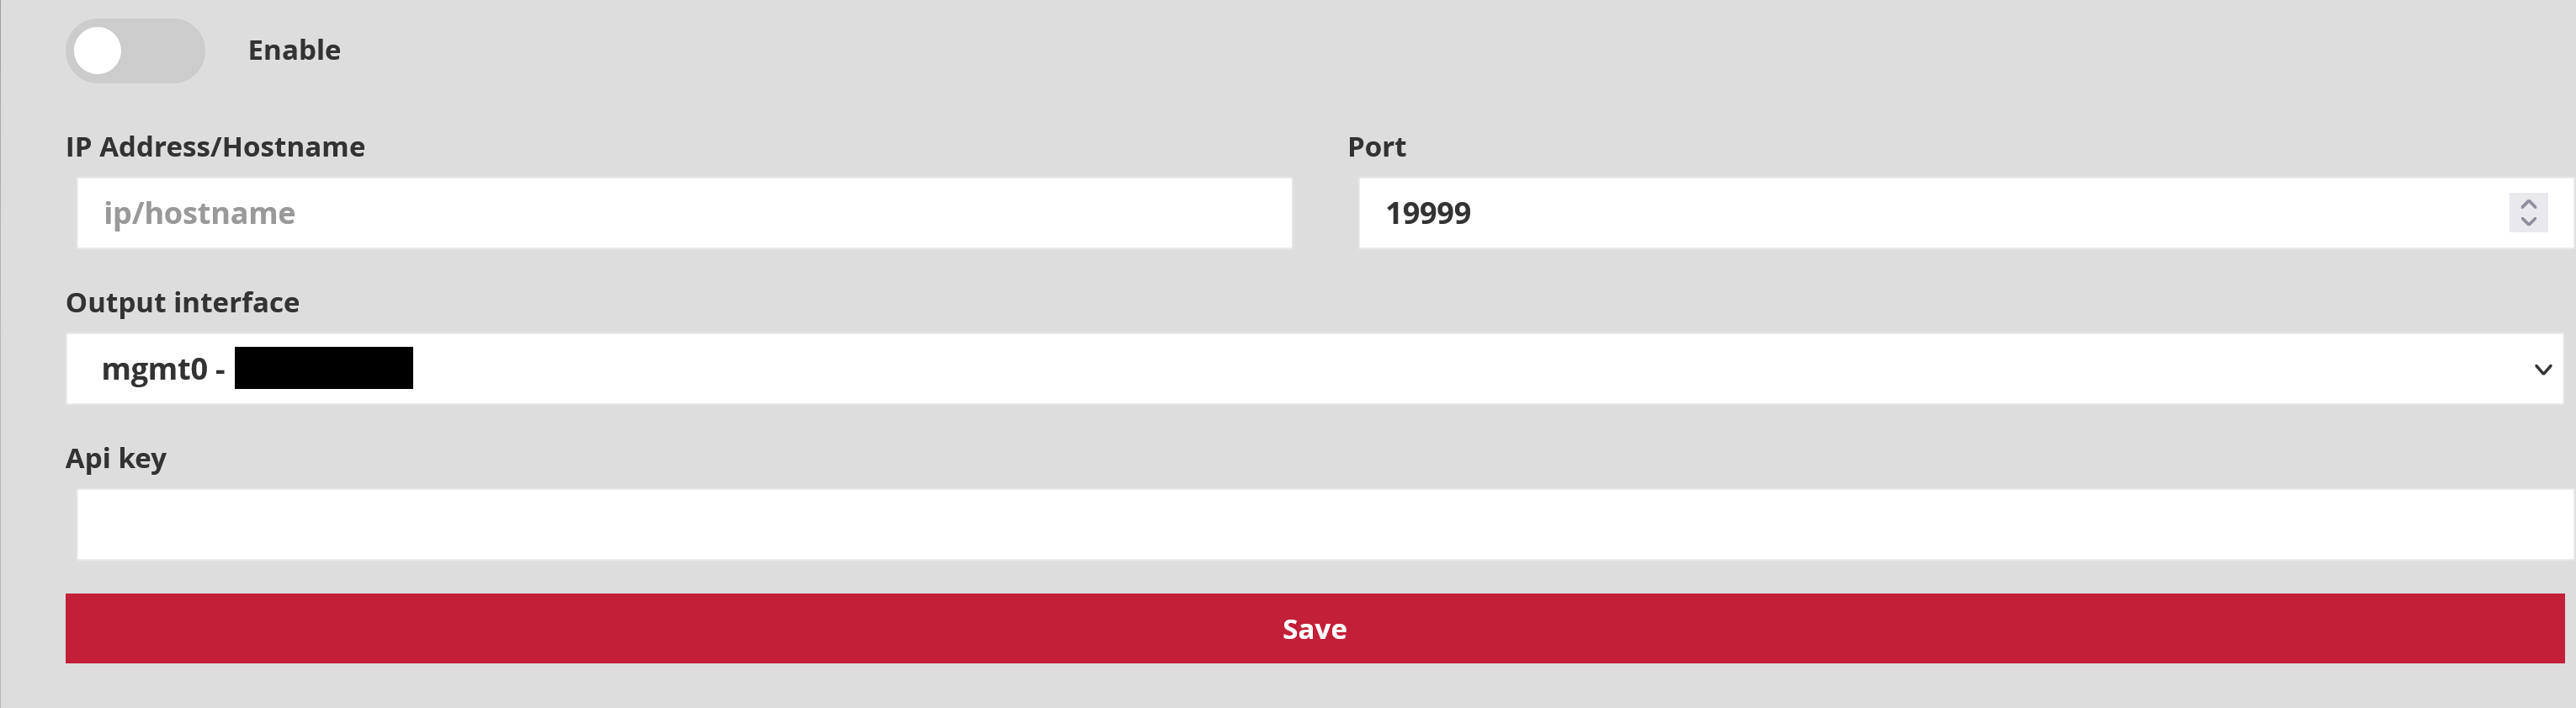
Enable: enables/disables the service.
IP Address/Hostname: the fqdn or IP address of the Netdata server.
Port: the listening port of the Netdate server.
Output interface: the exit in interface to use to reach the Netdata server.
API key: The API key of the Netdata server.
4.1.2. Netdata - Encryption
This section is required for the administrator to set up encryption of the communication between the GCENTER and its Netdata server. A certificate will be required to enable this feature.
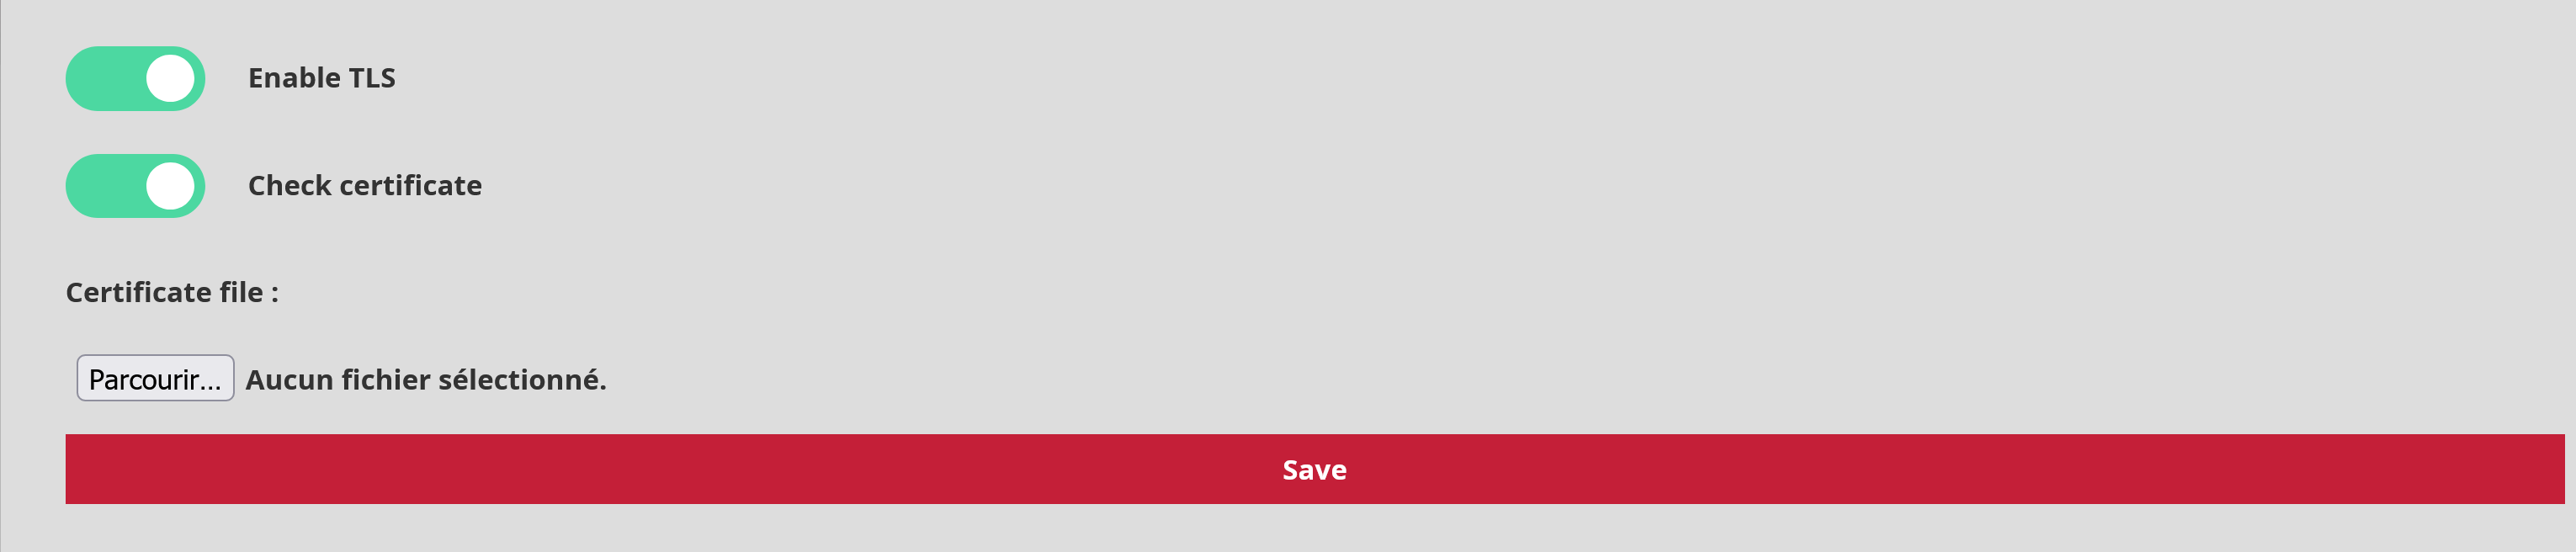
Enable TLS: Enable/Disable encryption. Disabled by default.
Check certificate: Enables/disables checking the validity of the certificate when the TLS service is enabled.
Any modification will only be applied after pressing** Save**.
More information is available in the [Using a Netdata Server] section (monitoring/netdata.html#using-a-netdata-server)