4. Syslog

Menu: Administrators > GCenter > Data export
4.1. Configuration Syslog
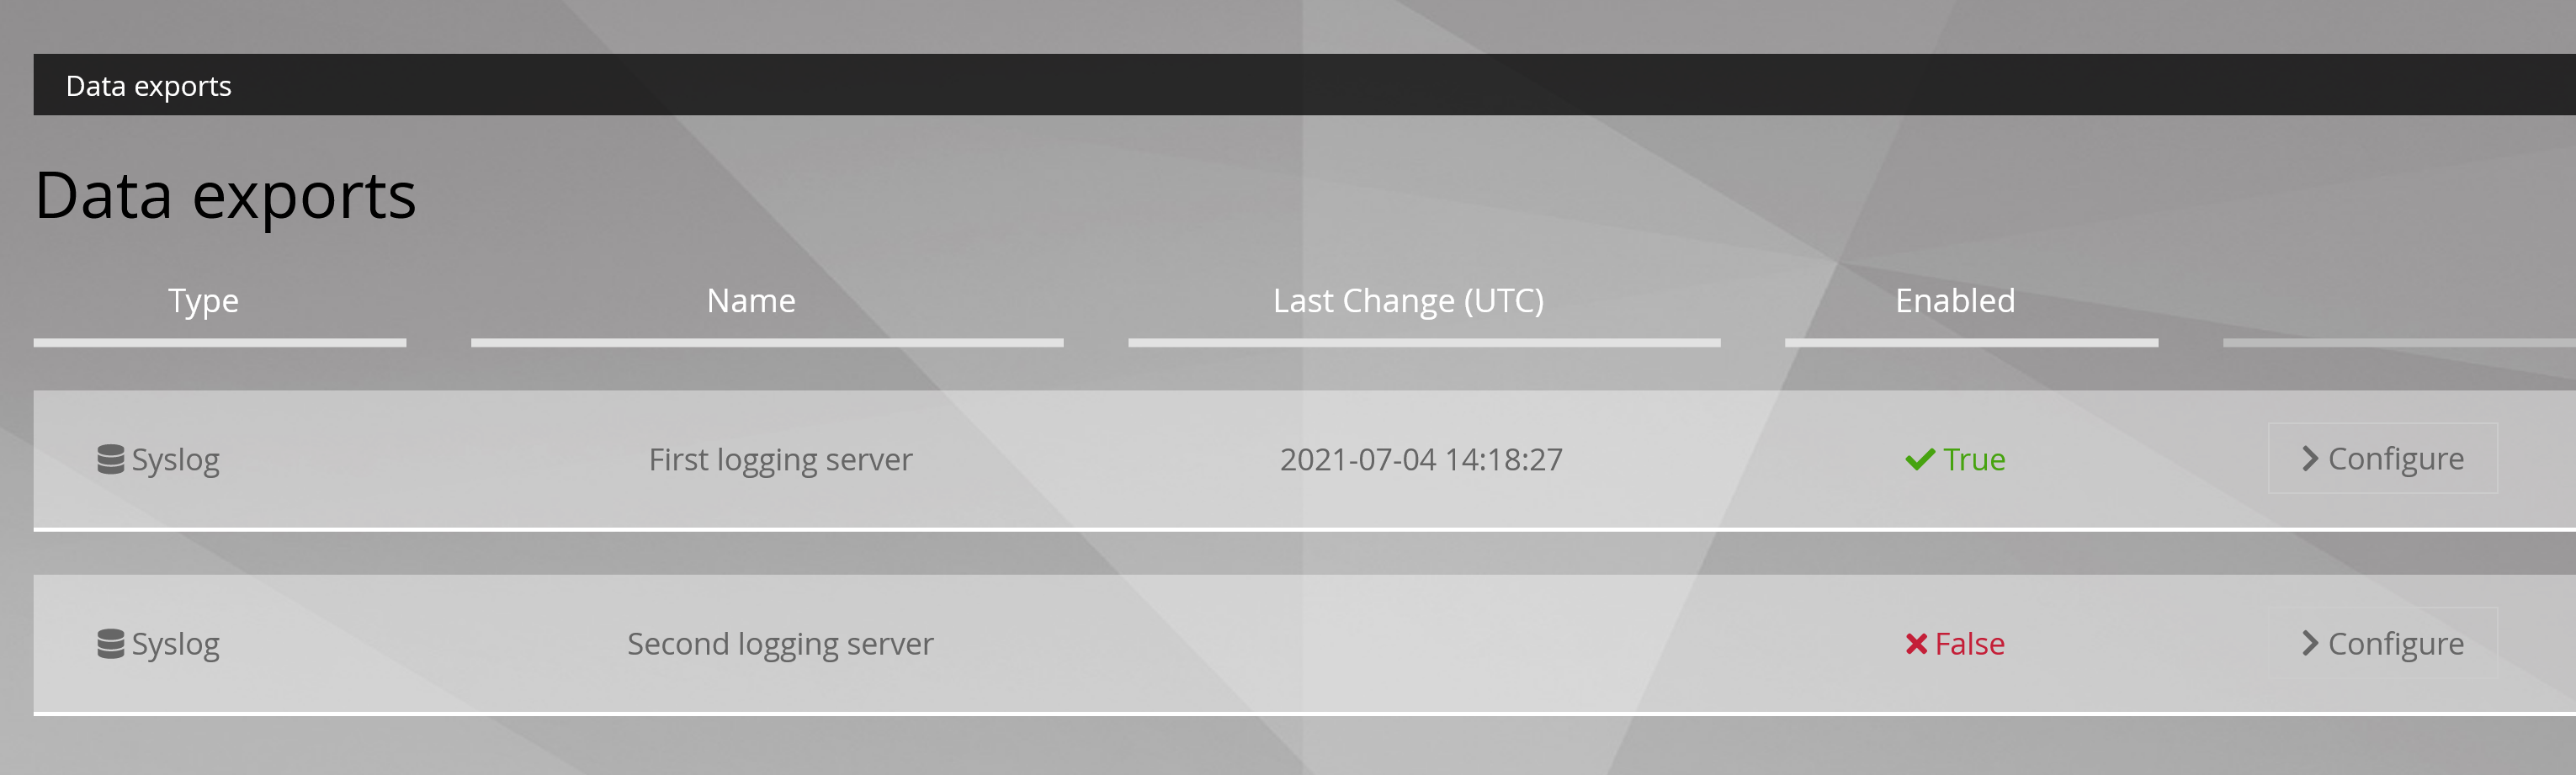
 From this section the solution administrators are able to export alerts or part of alerts to a security information and event management (SIEM).
The administrator can export the data in real time by targeting a primary and/or secondary Syslog correlator, whose dispatches can be configured.
In order for the TRACKWATCH solution to communicate its information to a Netdata server, this section must be configured with the necessary information. This configuration is carried out from three tabs:
4.1.1. General settings
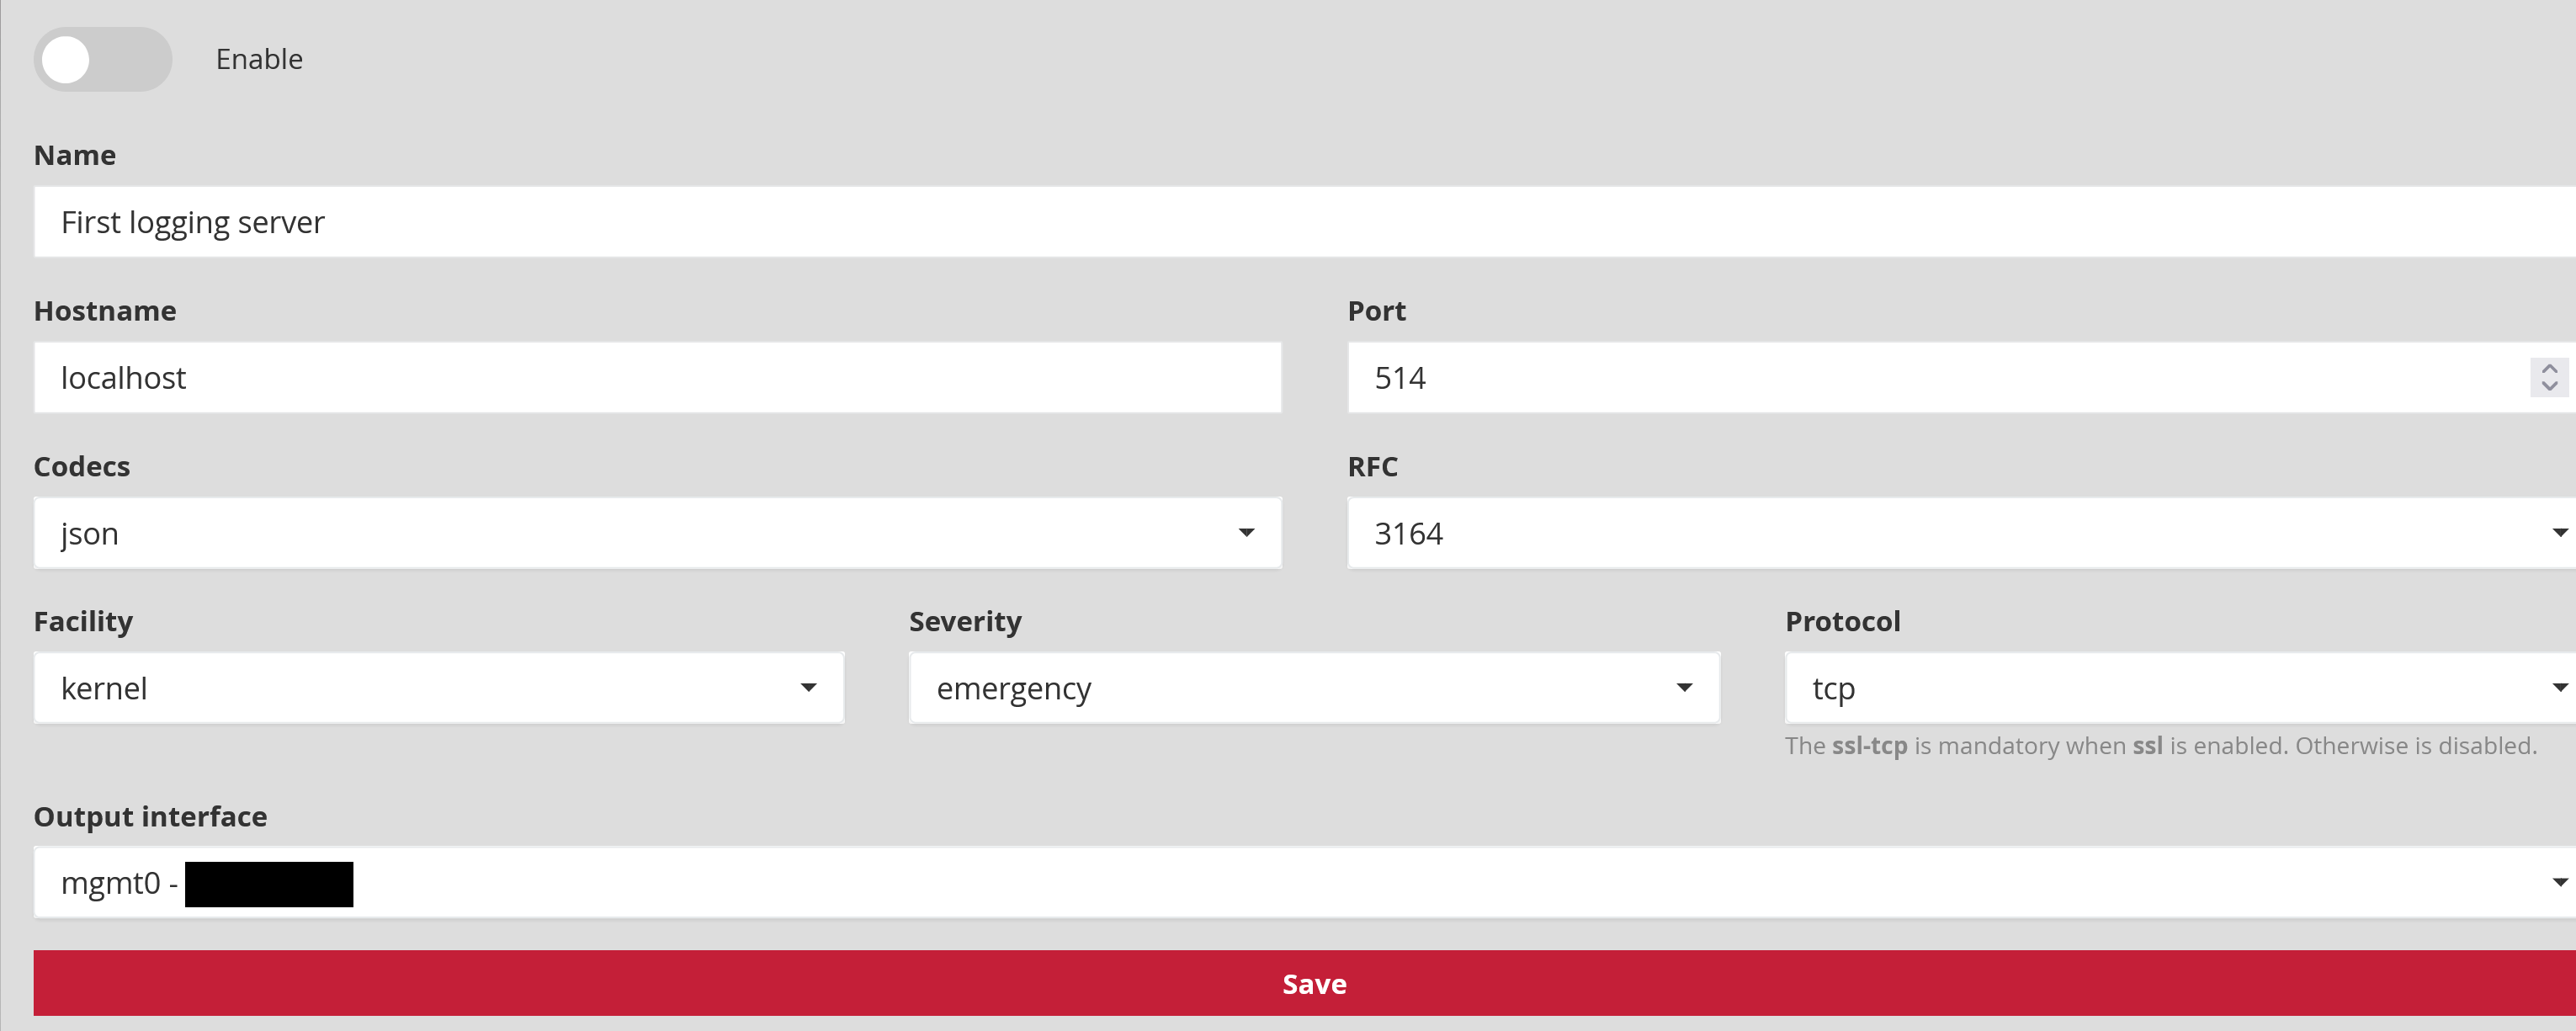
Enable activates or deactivates the Syslog export.
Name (Example: First logging server) is the name of the Syslog server assigned by the administrator.
Host name (Example: localhost or 192.168.199.1) is the IP address or the name of the Syslog server for the connection.
Port number: is the listening port of the Syslog server for the connection. The default value is 514.
Codec: (Example: json, idmef, cef ou plain) is the codec used for the output data. Output codecs are a convenient way to encode your data prior to export without the need for another filter. By default the value is in json.
** RFC** (Example: 3164 or 5424) enables selecting the corresponding RFC for the desired message normalisation.
Facility (Example: kernel, user-level, mail, deamon, security/authorization, syslogd, line printer, network news, uucp) refers to the message type used for sending to the Syslog server. The default value is a kernel.
Severity (Example: emergency, alert, critical, error, warning, notice, informational, debug) is the severity rate for Syslog messages. The default value is an emergency.
| Severity | Description |
|---|---|
| Emergency | The system is unusable |
| Alert | Action must be taken immediately |
| Critical | Conditions are severe. |
| Error | Failure conditions |
| Warning | Conditions of caution |
| Notice | Normal but significant condition |
| Informational | Explanatory messages |
| Debug | Repair level messages |
Protocol (Example: tcp, udp ou ssl_tcp) is the protocol used for data transfer. The default value is in TCP.
Note
SSL-TCP is mandatory if SSL encryption is enabled. Otherwise, it is disabled.
Output interface (Example: mgmt0, sup0) is the selected output interface between the GCENTER and the SIEM.
Any modification will only be applied after pressing '** Save**'.
4.1.2. Filtering
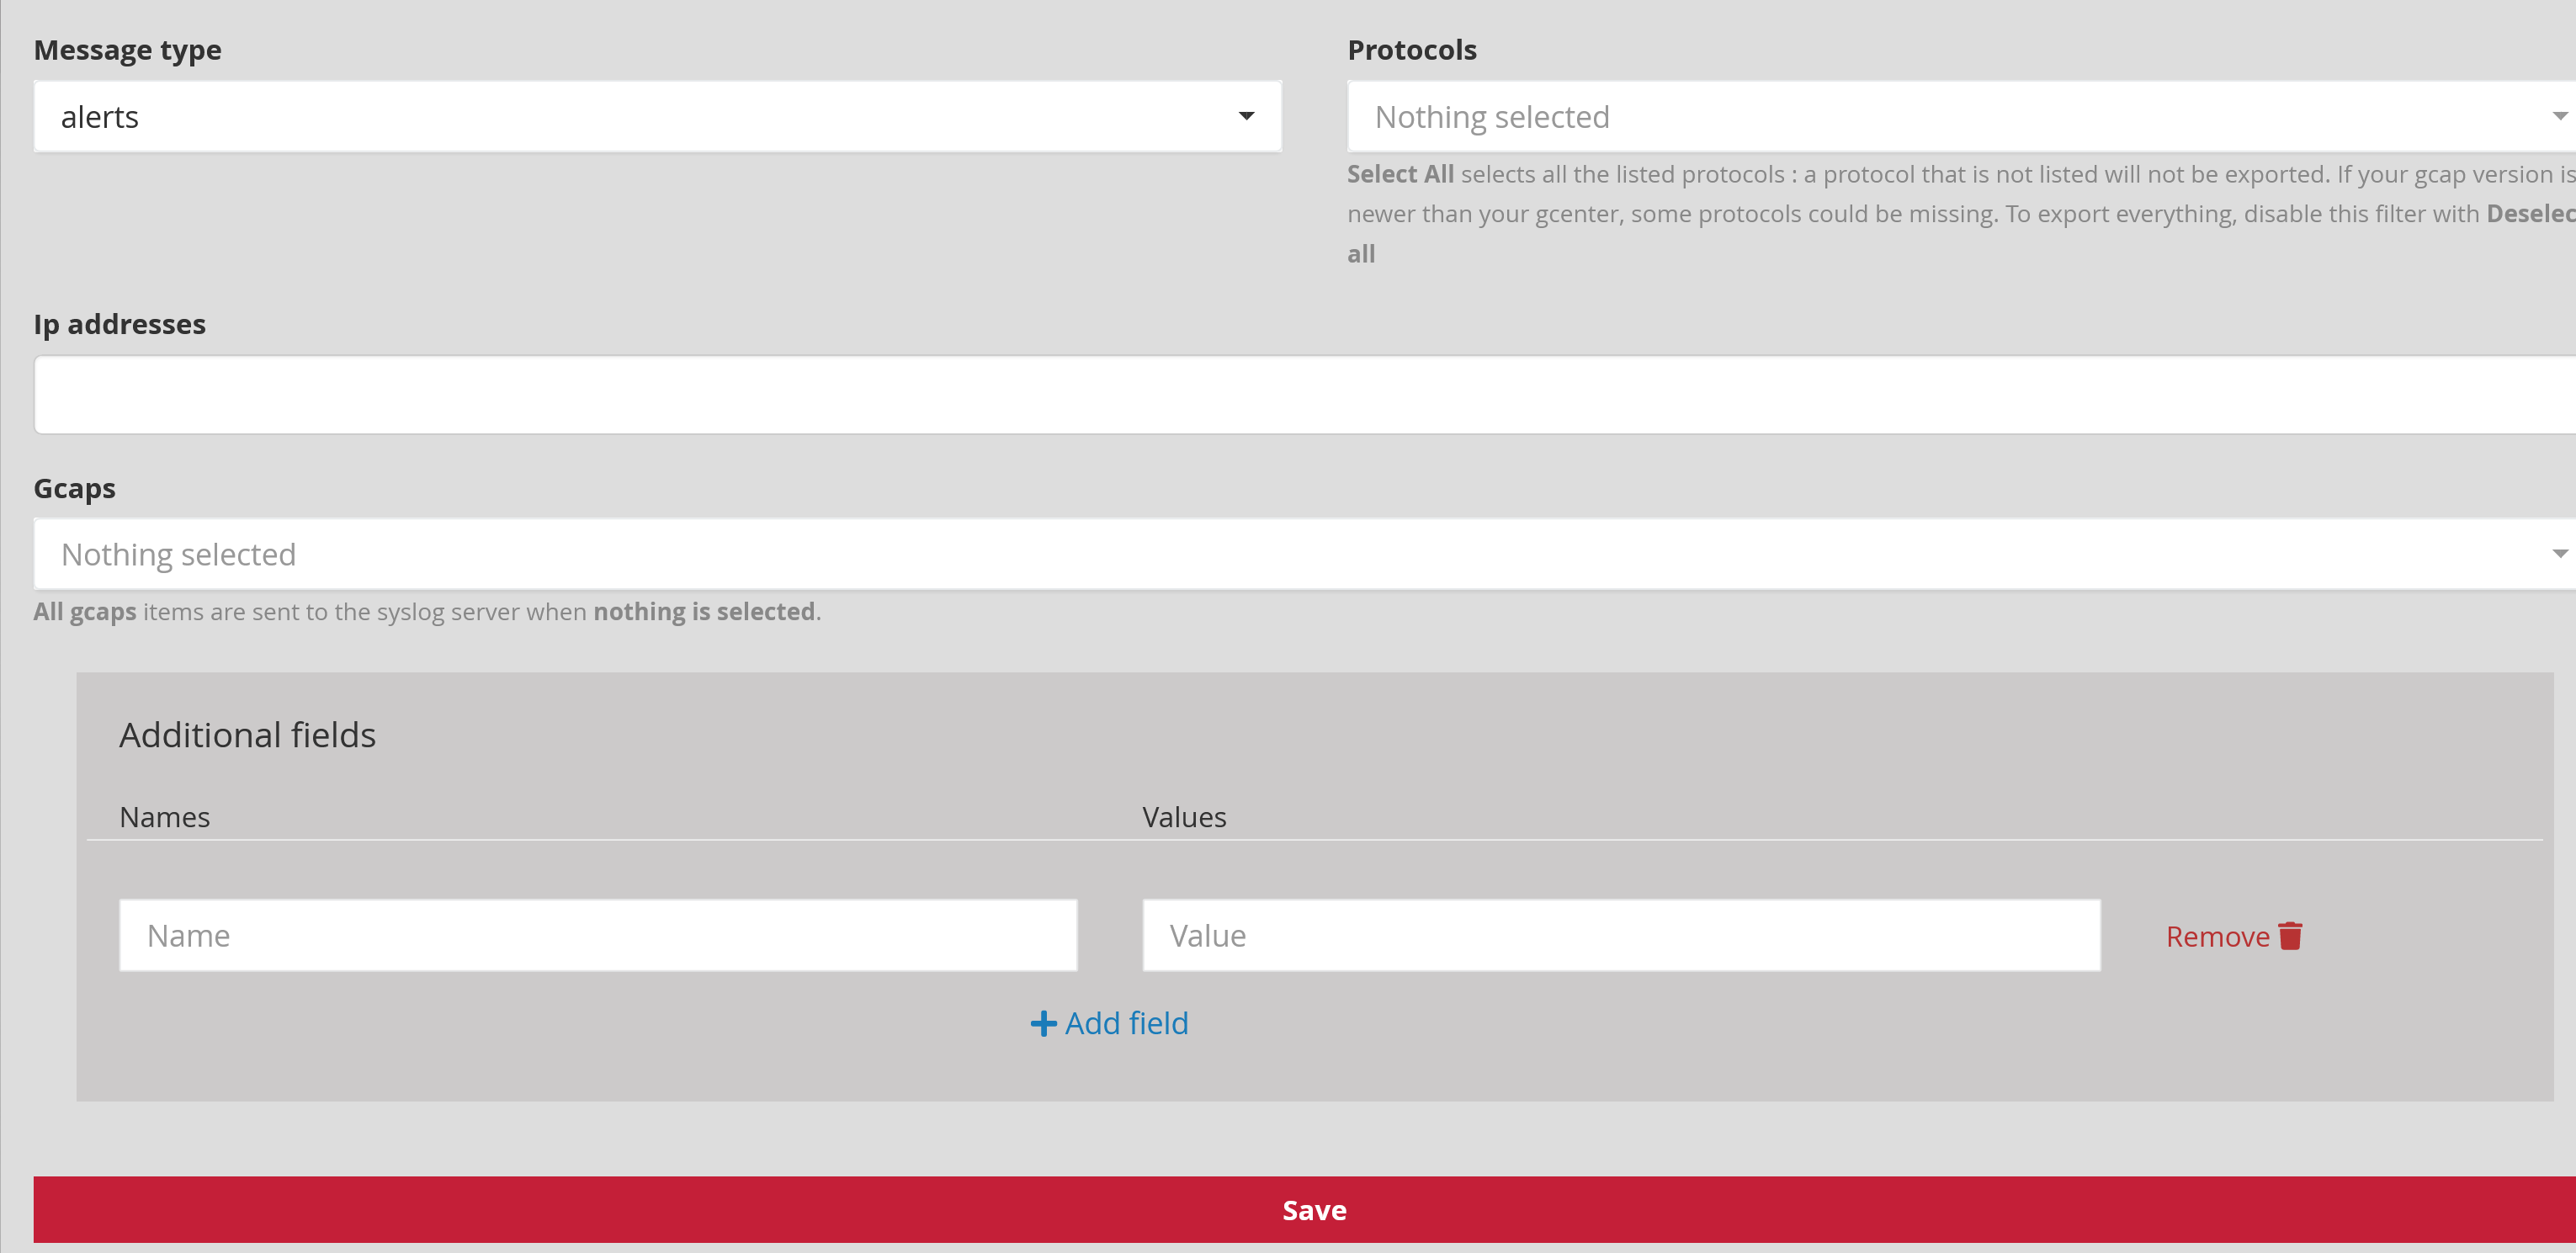
Message type: (Example: alerts, all) defines the type of event to be sent: only alerts or all information (metadata, fileinfo, ...)
Protocols: (Example: dcerpc, dhcp, dnp3, dns, ftp, http, ikev2, krb5, modbus, netflow, nfs, smb, smtp, ssh, tftp, tls et ntp) enables selecting the protocols to be exported.
Note
[Select All] will choose all listed protocols: a protocol that is not listed will not be exported. If the GCAP version is newer than that of the GCENTER, some protocols may be missing. To export everything, deactivate this filter with [Deselect all].
Gcaps: (Example: GCap1, GCap2) enables filtering by GCAP. All GCAP data paired with the GCENTER is sent to the Syslog server if nothing is selected.
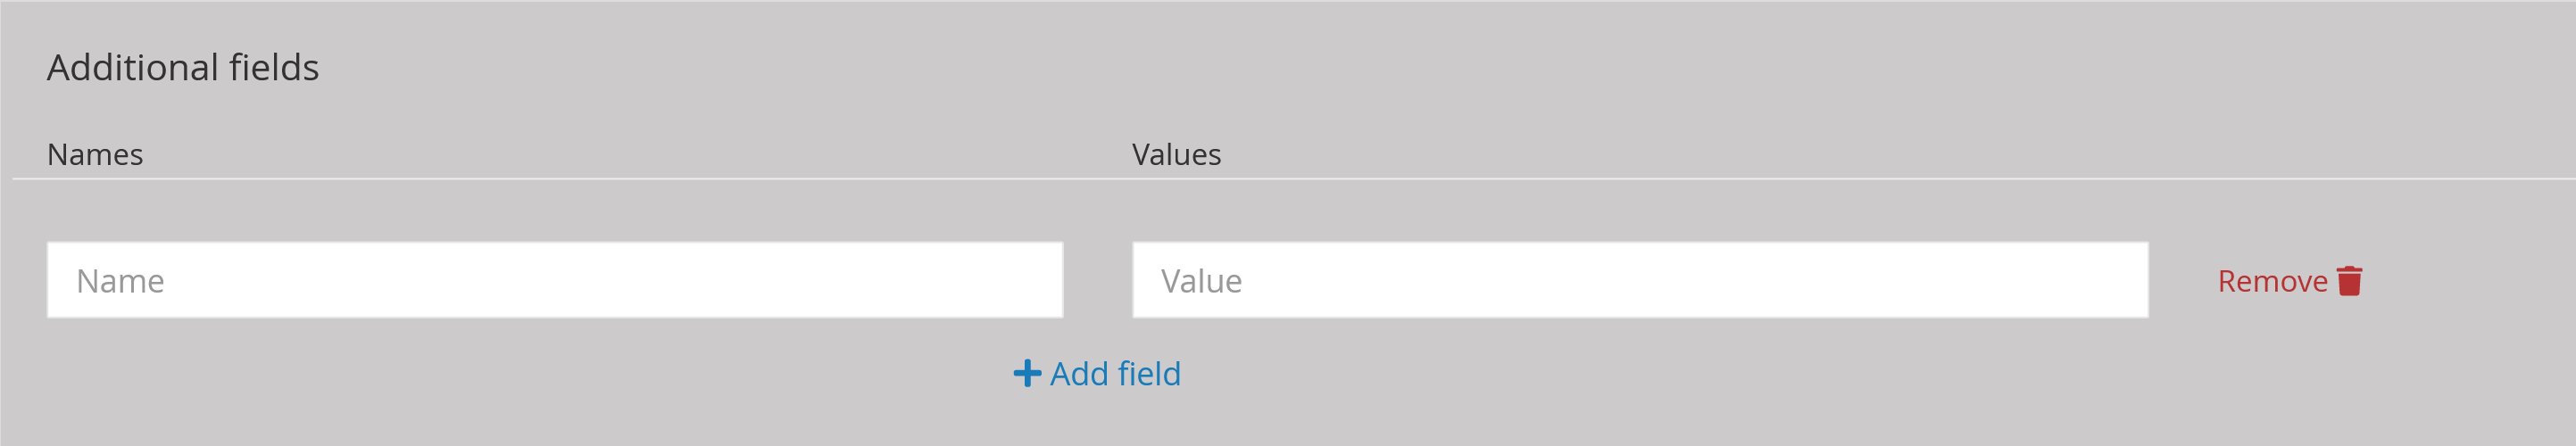
Additional fields enables the administrator to add more fields to the transferred data. A name (Name) and a description (value) can be entered in this window. When using the idmef codec, this field is not supported.
Any modification will only be applied after pressing '** Save**'.
4.1.3. Encryption
This section enables encryption to be added to the data transfer between the GCENTER and the syslog receiver. It will be necessary to add a certificate, the associated key, and the certification authority in order to validate this functionality.
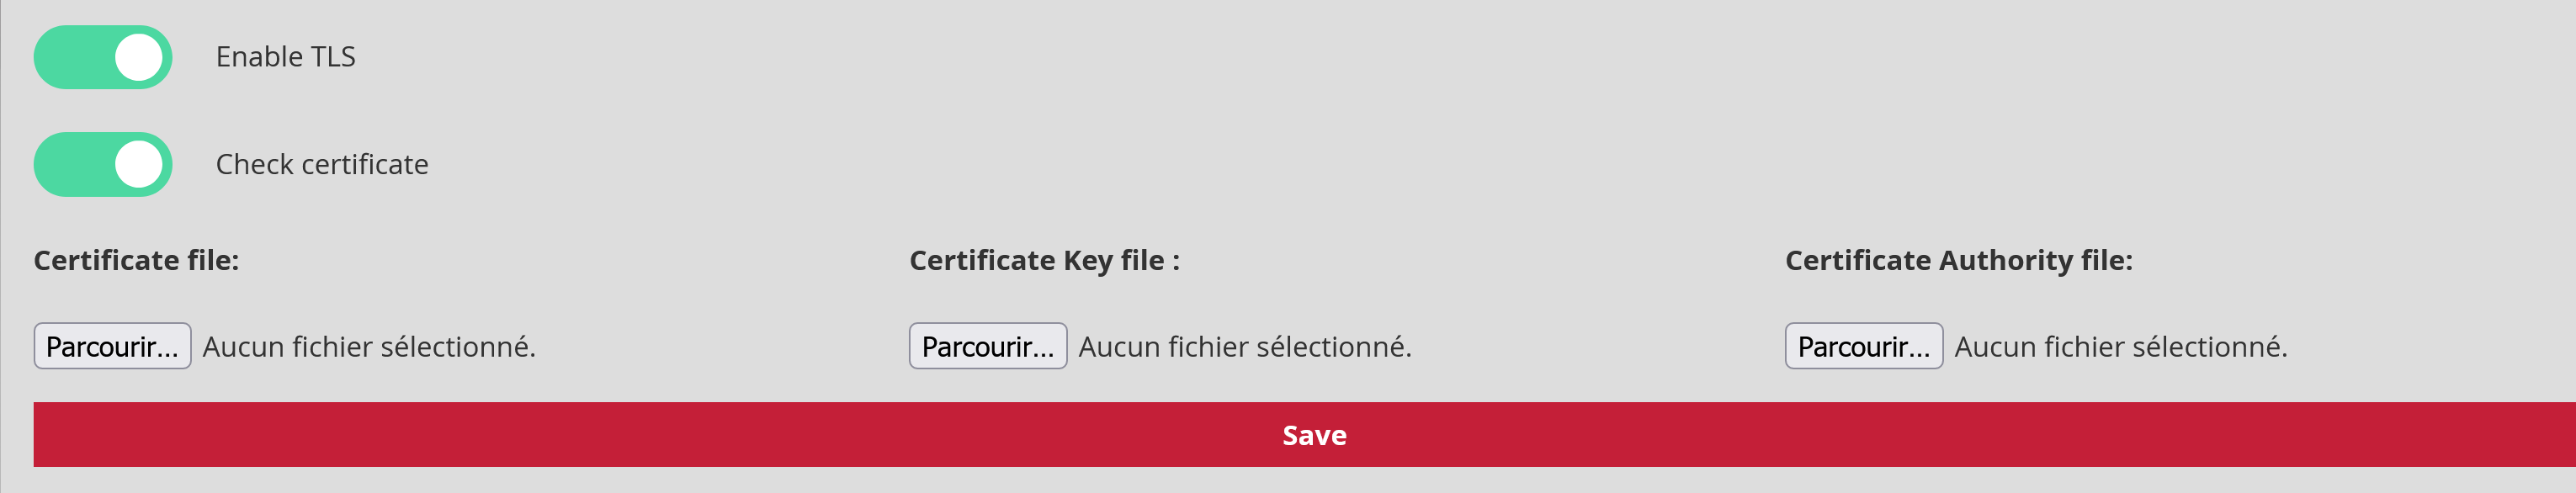
Enable TLS: Ability to activate the Transport Layer Security (TLS) service. Disabled by default.
Check certificate: setting to stop checking the validity of the certificate when the TLS service is enabled.
Any modification will only be applied after pressing '** Save**'.
4.2. Logstash
Menu: Administrators > GCenter > Data export
GCenter can export its logs to the Logstash ETL. A pipeline developed by Gatewatcher enables the JSON content of the exported logs to be retrieved and then manipulated as desired with Logstash filters. The Gcenter integration is therefore very fast. It only requires two steps:
On Gcenter, configure the data export to Logstash.
On Logstash, configure the pipeline to receive the flow from GCenter.
4.2.1. Configuring Logstash data export
Select one of the two export pipelines by clicking on Configure.
The following table summarises the parameters to be applied in the GENERAL tab.
Note
Values whose format is $VALUE are context specific. They are noted as such so that they can be referred to in the following documentation.
| Parameter | Description | Value |
|---|---|---|
| Enable | Activate this export pipeline | Enabled |
| Name | Name of Syslog export | $SYSLOG_NAME |
| Hostname | DNS name or IP address of Logstash server | $LOGSTASH_IP |
| Port | Destination Port | $LOGSTASH_PORT |
| Codecs | Codec used for export | JSON |
| RFC | Standard used by the codec | 3164 |
| Facility | Value of "facility" in the Syslog header | kernel by default; The header will be deleted by the reception pipeline |
| Severity | Value of "severity" in the Syslog header | emergency by default; The header will be deleted by the reception pipeline |
| Protocol | The transport protocol used. TCP or UDP can be used | $PROTOCOL |
| Output interface | Choose the GCenter interface used for the Syslog export | $GCENTER_IFACE |
The FILTERS tab enables selecting which logs will be exported. See filtering in the syslog section.
The "ENCRYPTION" tab enables activating the encryption of the flow generated by the GCenter. The Logstash "syslog" input is not compatible with data encryption. Therefore this feature cannot be used.
4.2.2. Pipeline Logstash
The input used is Syslog. In order to be compatible with any Syslog header, a grok pattern is defined. The JSON content of the log is in the syslog_message field.
input {
  syslog {
    port => $LOGSTASH_PORT
    type => syslog
    grok_pattern => '^<%{NUMBER:syslog_priority}>(?:1 |)(?:%{SYSLOGTIMESTAMP:syslog_timestamp}|%{TIMESTAMP_ISO8601:syslog_timestamp}) %{SYSLOGHOST:syslog_hostname} (?:gatewatcher\[-\]:|gatewatcher - - \[-\]) %{GREEDYDATA:syslog_message}\n$'
  }
}
Only the syslog_message field is kept, and converted to JSON. The original field (syslog_message) and the elasticsearch specific field (@version) are then removed.
filter {
  prune {
    whitelist_names => [ "syslog_message" ]
  }

  json {
    source => "syslog_message"
  }

  mutate {
    remove_field => [ "@version","syslog_message" ]
  }

 }
Any output can then be used. In this example, the logs are written directly to disk as files:
output {
  file {
    path => '/usr/share/logstash/data/output/%{[type]}-%{+YYYY.MM.dd}.log'
    codec => json_lines
  }
}
4.2.3. Quick POC
A POC with a Logstash docker can be achieved in a few minutes. The following commands, provided as a guide, should make this task easier.
Important
The commands are purely indicative in order to assemble a demonstrator quickly. It does not adhere to the best practices necessary to develop a production component.
On a linux machine having docker, execute the following commands to retrieve the default Logstash configuration files: (procedure tested with Logstash version 7.13.1)
mkdir logstash_docker
cd logstash_docker
sudo docker run --name="logstash_tmp" --rm -d -it docker.elastic.co/logstash/logstash:7.13.1
sudo docker cp logstash_tmp:/usr/share/logstash/config config
sudo docker cp logstash_tmp:/usr/share/logstash/pipeline pipeline
sudo docker rm -f logstash_tmp
The resulting folder is logstash_docker, within which two subfolders appear: config and pipeline.
In config, the settings can be retained by default, with the exception of the xpack.monitoring.elasticsearch.hosts setting, which should be annotated in logstash.yaml.
In the pipeline folder, replace the default pipeline with the one described in the section above.
A docker using these configuration files and this pipeline can then be started.
sudo docker run --name="logstash_export" --rm -d -it -p $LOGSTASH_PORT:$LOGSTASH_PORT/$PROTOCOL -v $(pwd)/config/:/usr/share/logstash/config/ -v $(pwd)/pipeline:/usr/share/logstash/pipeline/ -v $(pwd)/output:/usr/share/logstash/data/output/ --user $(id -u):$(id -g) docker.elastic.co/logstash/logstash:7.13.1
Logstash will then create an output directory in which the received logs will be written, with one JSON per line.
4.3. Splunk
Menu: Administrators > GCenter > Data export
GCenter can export its logs to the Splunk SIEM. A Technological Add-On (TA) developed by Gatewatcher enables mapping the logs exported by the GCenter to Splunk data models. The Gcenter integration is therefore very fast. It only requires three steps:
On Gcenter, configure the data export to Splunk.
On the Splunk server, install the TA compatible with the GCenter version installed. In this instance, TA-gatewatcher-gcenter-v101.
On the Splunk server, configure the data reception from the GCenter and associate it with the TA.
Note
The Splunk TA is still in beta version. The TA content is detailed at the end of this documentation so the administrators can adapt it to their needs.
4.3.1. Configuring Splunk data export
Select one of the two export pipelines by clicking on "Configure"
The following table summarises the parameters to be applied in the "GENERAL" tab.
Note
Values whose format is $VALUE are context specific. They are noted as such so that they can be referred to in the following documentation.
| Parameter | Description | Value |
|---|---|---|
| Enable | Activate this export pipeline | Enabled |
| Name | Name of Syslog export | $SYSLOG_NAME |
| Hostname | DNS name or IP address of the Splunk server | $SPLUNK_IP |
| Port | Syslog flow destination port | $SYSLOG_PORT |
| Codecs | Codec used for export | JSON |
| RFC | Standard used by the codec | 3164 |
| Facility | Value of "facility" in the Syslog header | kernel by default; The header will be deleted by the TA Splunk. |
| Severity | Value of "severity" in the Syslog header | emergency by default; The header will be deleted by the TA Splunk. |
| Protocol | The transport protocol used. TCP or UDP can be used | $PROTOCOL |
| Output interface | Choose the GCenter interface used for the Syslog export | $GCENTER_IFACE |
The "FILTERS" tab enables selecting which logs will be exported. See filtering in the syslog section.
The "ENCRYPTION" tab enables encrypting the flow between the GCenter and Splunk if necessary. $PROTOCOL should then be TCP. If encryption is enabled, the Splunk data input configuration (input.conf) must contain the appropriate stanzas. This guide does not cover the encryption configuration between the GCenter and Splunk.
4.3.2. Installing the TA
Download the TA here: TA-gatewatcher-gcenter-v101-0.1.0.spl
Installing the TA is the same as in any Splunk app. The steps are as follows, however, see the documentation for your version of Splunk for more details:
Manage apps > Install an app from a file > choose Gatewatcher TA > "Send"
By clicking on "View objects" in the Splunk app management menu, you can access all the objects provided by the TA:
The definition of field aliases.
The definition of eventtypes.
Associations between eventtypes and tags.
You can enable/disable objects from this interface and change their permissions. By default, permissions are set to "Global" - Read for everyone - Write for admins only.
4.3.3. Configuring data reception
Configuring the data input at the Splunk level must be done consistently with the GCenter configuration.
In Splunk, the configuration will be done in Settings > Data > Data inputs > TCP/UDP
The following table summarises the parameters to be applied for the data input to work:
| Parameter | Description | Value |
|---|---|---|
| TCP/UDP | Transport protocol used | Must be equal to $PROTOCOL |
| Port | Listening port on the Splunk server | Must be equal to $SYSLOG_PORT |
| Sourcetype | Sourcetype assigned to the received flow | gw:gcenter:101 |
| App context | App in which the input.conf file for this entry will be placed | TA-gatewatcher-gcenter-101 |
| Index | Index to which the received data will be written | Depending on your data architecture, a specific index can be used for the Gatewatcher logs. |
4.3.4. Composition of the TA
The TA consists of the following files, placed in the application's default directory. Changes can be made to these files to adapt the behaviour of the TA to your specific needs and use of the data models. The recommended best practice is to create a local' folder and keep the default' folder intact (see Splunk documentation on `how to edit a configuration file').
4.3.4.1. props.conf
[gw:gcenter:101]
KV_MODE = json
MAX_TIMESTAMP_LOOKAHEAD = 31
The following section removes the Syslog headers and the @version field from elasticsearch, which is not used.
SEDCMD-gw-1-remove-header = s/^([^\{]+)//
SEDCMD-gw-2-remove-host = s/\"host\":\"[^\s"]+\",?//
SEDCMD-gw-3-remove-version = s/\"@version\":\"[^\s"]+\",?//
SEDCMD-gw-4-remove-trailing_comma = s/,}/}/
TIME_FORMAT = %Y-%m-%dT%H:%M:%S.%6N%Z
TIME_PREFIX = \"timestamp_detected\":\"
The following transformation is called gw_force_host in transforms.conf. It enables the GCenter name to be associated with the host field used by Splunk.
TRANSFORMS-host = gw_force_host
The following transformation calls the stanzas sourcetype_* from transforms.conf in order to associate a sourcetype based on the engine that generated the log.
TRANSFORMS-override_sourcetype_engine = sourcetype_malcore,sourcetype_codebreaker,sourcetype_sigflow,sourcetype_sigflow_alert
The logs cannot exceed 65 kb. GCenter are in UTC.
TRUNCATE = 65535
TZ = UTC
category = Splunk App Add-on Builder
pulldown_type = 1
The rest of props.conf enables field aliases to be associated with each sourcetype. Field evaluations enable logs to be transformed to match data models.
[gw:gcenter:101:sigflow:meta]
FIELDALIAS-gw_gcenter_101_sigflow_meta_src = src_ip AS src
FIELDALIAS-gw_gcenter_101_sigflow_meta_dest = dest_ip AS dest
FIELDALIAS-gw_gcenter_101_sigflow_meta_hash = fileinfo.sha256 AS file_hash
FIELDALIAS-gw_gcenter_101_sigflow_meta_alias_1 = tcp.tcp_flags AS tcp_flag
FIELDALIAS-gw_gcenter_101_sigflow_meta_alias_2 = netflow.pkts AS packets
FIELDALIAS-gw_gcenter_101_sigflow_meta_alias_3 = netflow.bytes AS bytes
FIELDALIAS-gw_gcenter_101_sigflow_meta_alias_4 = event_type AS app

FIELDALIAS-gw_gcenter_101_sigflow_meta_http_alias_02 = http.status AS status
FIELDALIAS-gw_gcenter_101_sigflow_meta_http_alias_03 = http.length AS bytes
FIELDALIAS-gw_gcenter_101_sigflow_meta_http_alias_04 = http.url AS uri_query
FIELDALIAS-gw_gcenter_101_sigflow_meta_http_alias_05 = http.hostname AS url_domain
FIELDALIAS-gw_gcenter_101_sigflow_meta_http_alias_06 = http.http_content_type AS http_content_type
FIELDALIAS-gw_gcenter_101_sigflow_meta_http_alias_07 = http.http_method AS http_method
FIELDALIAS-gw_gcenter_101_sigflow_meta_http_alias_08 = http.http_user_agent AS http_user_agent
FIELDALIAS-gw_gcenter_101_sigflow_meta_http_alias_09 = http.http_refer AS http_referrer

EVAL-action = "allowed"
EVAL-protocol = "ip"
EVAL-transport = lower(proto)
EVAL-url = url_domain+uri_query

[gw:gcenter:101:sigflow:alert]
EVAL-action = "allowed"
EVAL-transport = low(proto)
FIELDALIAS-gw_gcenter_101_sigflow_alert_alias_1 = src_ip AS src
FIELDALIAS-gw_gcenter_101_sigflow_alert_alias_2 = dest_ip AS dest
FIELDALIAS-gw_gcenter_101_sigflow_alert_alias_3 = alert.signature AS signature
FIELDALIAS-gw_gcenter_101_sigflow_alert_alias_4 = alert.signature_id AS signature_id
FIELDALIAS-gw_gcenter_101_sigflow_alert_alias_5 = severity AS severity_id

[gw:gcenter:101:malcore]
FIELDALIAS-gw_gcenter_101_malcore_src = src_ip AS src
FIELDALIAS-gw_gcenter_101_malcore_dest = dest_ip AS dest
FIELDALIAS-gw_gcenter_101_malcore_hash = SHA256 AS file_hash
FIELDALIAS-gw_gcenter_101_malcore_alias_2 = src_ip AS src
FIELDALIAS-gw_gcenter_101_malcore_alias_3 = dest_ip AS dest
FIELDALIAS-gw_gcenter_101_malcore_alias_4 = filename AS file_name
FIELDALIAS-gw_gcenter_101_malcore_alias_5 = http_uri AS file_path
FIELDALIAS-gw_gcenter_101_malcore_alias_6 = total_found AS signature_id

[gw:gcenter:101:codebreaker]
FIELDALIAS-gw_gcenter_101_codebreaker_src = src_ip AS src
FIELDALIAS-gw_gcenter_101_codebreaker_dest = dest_ip AS dest
FIELDALIAS-gw_gcenter_101_codebreaker_hash = SHA256 AS file_hash
FIELDALIAS-gw_gcenter_101_codebreaker_alias_4 = event_type AS category
4.3.4.2. transforms.conf
The stanzas in this file are used by props.conf. They concern fields indexed by Splunk, like host or sourcetype.
[gw_force_host]
LOOKAHEAD = 65535
DEST_KEY = MetaData:Host
REGEX = \"GCenter\"\:\"([^\"]+)
FORMAT = host::$1

[sourcetype_malcore]
LOOKAHEAD = 65535
REGEX = \"type\"\:\"malcore\"
FORMAT = sourcetype::gw:gcenter:101:malcore
DEST_KEY = MetaData:Sourcetype

[sourcetype_codebreaker]
LOOKAHEAD = 65535
REGEX = \"type\"\:\"codebreaker\"
FORMAT = sourcetype::gw:gcenter:101:codebreaker
DEST_KEY = MetaData:Sourcetype

[sourcetype_sigflow]
LOOKAHEAD = 65535
REGEX = \"type\"\:\"suricata\"
FORMAT = sourcetype::gw:gcenter:101:sigflow:meta
DEST_KEY = MetaData:Sourcetype

[sourcetype_sigflow_alert]
LOOKAHEAD = 65535
REGEX = \"event_type\"\:\"alert\"
FORMAT = sourcetype::gw:gcenter:101:sigflow:alert
DEST_KEY = MetaData:Sourcetype
4.3.4.3. eventtype.conf
This file enables associations between logs and events.
Events related to antivirus file analysis (malcore):
[malcore_clean]
search = (sourcetype=gw:gcenter:101:malcore event_type=malware retroact="None" code=0 )
description = An event that occurs when malcore analyses a file and none of the engines detects a threat

[malcore_infected]
search = (sourcetype=gw:gcenter:101:malcore event_type=malware retroact="None" code=1)
description = An event that occurs when malcore analyses a file and at least one of the engines detects a threat
color = et_red

[malcore_suspicious]
search = (sourcetype=gw:gcenter:101:malcore event_type=malware retroact="None" code=2)
description = An event that occurs when malcore analyses a file, none of the engines detects a threat but at least one classifies the file as suspicious. Suspicious files can be analysed later by retroact, if enabled.
color = et_orange

[malcore_other]
search = (sourcetype=gw:gcenter:101:malcore event_type=malware retroact="None" NOT code IN (0,1,2))
description = An event that occurs when malcore returns a code indicating an exception or a failure in the analysis.
color = et_blue
Events related to the antivirus reanalysis of suspicious files (retroact):
[retroact_clean]
search = (sourcetype=gw:gcenter:101:malcore event_type=malware retroact!="None" code=0 )
description = An event that occurs when retroact analyses a file and none of the engines detects a threat
color = et_blue

[retroact_infected]
search = (sourcetype=gw:gcenter:101:malcore event_type=malware retroact!="None" code=2)
description = An event that occurs when retroact analyses a file and at least one of the engines detects a threat
color = et_red

[retroact_suspicious]
search = (sourcetype=gw:gcenter:101:malcore event_type=malware retroact!="None" code=2)
description = An event that occurs when retroact analyses a file, none of the engines detects a threat but at least one classifies the file as suspicious. Suspicious files can be analysed later by retroact, if enabled.
color = et_orange

[retroact_other]
search = (sourcetype=gw:gcenter:101:malcore event_type=malware retroact!="None" NOT code IN (0,1,2))
description = An event that occurs when retroact returns a code indicating an exception or a failure in the analysis.
color = et_blue
Netflow logging activation event on the gcap:
[sigflow_netflow]
search = (sourcetype=gw:gcenter:101:sigflow:meta event_type=netflow)
description = An event that occurs when sigflow generates a netflow event from a network event.
Events related to file reconstruction by gcap:
[sigflow_fileinfo_stored]
search = (sourcetype=gw:gcenter:101:sigflow:meta event_type=fileinfo fileinfo.stored="true")
description = An event that occurs when sigflow performs a file reconstruction and based on its ruleset, stored it on disk to perform malcore analysis afterwards.
color = et_blue

[sigflow_fileinfo_not_stored]
search = (sourcetype=gw:gcenter:101:sigflow:meta event_type=fileinfo fileinfo.stored="false")
description = An event that occurs when sigflow performs a file reconstruction and based on its ruleset, has not stored it on disk.
Events related to the sigflow engine can be of two types for each protocol:
Meta" event: generation of metadata obtained by activating the logging of the protocol on the gcap.
alert" event: an alert is generated, obtained by activating the protocol parsing on the gcap, and the correspondence between a flow and a sigflow rule.
[sigflow_meta_dcerpc]
search = (sourcetype=gw:gcenter:101:sigflow:meta event_type=dcerpc)
description = An event that occurs when sigflow reconstructs a dcerpc flow and logged its metadata.

[sigflow_alert_dcerpc]
search = (sourcetype=gw:gcenter:101:sigflow:alert event_type=alert app_proto=dcerpc)
description = An event that occurs when sigflow reconstructs a dcerpc flow and one of its rules matched the content of this flow.
color = et_red

[sigflow_meta_dhcp]
search = (sourcetype=gw:gcenter:101:sigflow:meta event_type=dhcp)
description = An event that occurs when sigflow reconstructs a dhcp flow and logged its metadata.

[sigflow_alert_dhcp]
search = (sourcetype=gw:gcenter:101:sigflow:alert event_type=alert app_proto=dhcp)
description = An event that occurs when sigflow reconstructs a dhcp flow and one of its rules matched the content of this flow.
color = et_red

[sigflow_meta_dnp3]
search = (sourcetype=gw:gcenter:101:sigflow:meta event_type=dnp3)
description = An event that occurs when sigflow reconstructs a dnp3 flow and logged its metadata.

[sigflow_alert_dnp3]
search = (sourcetype=gw:gcenter:101:sigflow:alert event_type=alert app_proto=dnp3)
description = An event that occurs when sigflow reconstructs a dnp3 flow and one of its rules matched the content of this flow.
color = et_red

[sigflow_meta_dns]
search = (sourcetype=gw:gcenter:101:sigflow:meta event_type=dns)
description = An event that occurs when sigflow reconstructs a dns flow and logged its metadata.
priority = 2

[sigflow_alert_dns]
search = (sourcetype=gw:gcenter:101:sigflow:alert event_type=alert app_proto=dns)
description = An event that occurs when sigflow reconstructs a dns flow and one of its rules matched the content of this flow.
color = et_red

[sigflow_meta_ftp]
search = (sourcetype=gw:gcenter:101:sigflow:meta event_type=ftp)
description = An event that occurs when sigflow reconstructs a ftp flow and logged its metadata.

[sigflow_alert_ftp]
search = (sourcetype=gw:gcenter:101:sigflow:alert event_type=alert app_proto=ftp)
description = An event that occurs when sigflow reconstructs a ftp flow and one of its rules matched the content of this flow.
color = et_red

[sigflow_meta_http]
search = (sourcetype=gw:gcenter:101:sigflow:meta event_type=http)
description = An event that occurs when sigflow reconstructs a http flow and logged its metadata.

[sigflow_alert_http]
search = (sourcetype=gw:gcenter:101:sigflow:alert event_type=alert app_proto=http)
description = An event that occurs when sigflow reconstructs a http flow and one of its rules matched the content of this flow.
color = et_red

[sigflow_meta_ikev2]
search = (sourcetype=gw:gcenter:101:sigflow:meta event_type=ikev2)
description = An event that occurs when sigflow reconstructs a ikev2 flow and logged its metadata.

[sigflow_alert_ikev2]
search = (sourcetype=gw:gcenter:101:sigflow:alert event_type=alert app_proto=ikev2)
description = An event that occurs when sigflow reconstructs a ikev2 flow and one of its rules matched the content of this flow.
color = et_red

[sigflow_meta_krb5]
search = (sourcetype=gw:gcenter:101:sigflow:meta event_type=krb5)
description = An event that occurs when sigflow reconstructs a krb5 flow and logged its metadata.

[sigflow_alert_krb5]
search = (sourcetype=gw:gcenter:101:sigflow:alert event_type=alert app_proto=krb5)
description = An event that occurs when sigflow reconstructs a krb5 flow and one of its rules matched the content of this flow.
color = et_red

[sigflow_meta_modbus]
search = (sourcetype=gw:gcenter:101:sigflow:meta event_type=modbus)
description = An event that occurs when sigflow reconstructs a modbus flow and logged its metadata.

[sigflow_alert_modbus_alert]
search = (sourcetype=gw:gcenter:101:sigflow:alert event_type=alert app_proto=modbus)
description = An event that occurs when sigflow reconstructs a modbus flow and one of its rules matched the content of this flow.
color = et_red

[sigflow_meta_nfs]
search = (sourcetype=gw:gcenter:101:sigflow:meta event_type=nfs)
description = An event that occurs when sigflow reconstructs a nfs flow and logged its metadata.

[sigflow_alert_nfs]
search = (sourcetype=gw:gcenter:101:sigflow:alert event_type=alert app_proto=nfs)
description = An event that occurs when sigflow reconstructs an nfs flow and one of its rules matched the content of this flow.
color = et_red

[sigflow_meta_ntp]
search = (sourcetype=gw:gcenter:101:sigflow:meta event_type=ntp)
description = An event that occurs when sigflow reconstructs a ntp flow and logged its metadata.

[sigflow_alert_ntp]
search = (sourcetype=gw:gcenter:101:sigflow:alert event_type=alert app_proto=ntp)
description = An event that occurs when sigflow reconstructs an ntp flow and one of its rules matched the content of this flow.
color = et_red

[sigflow_meta_smb]
search = (sourcetype=gw:gcenter:101:sigflow:meta event_type=smb)
description = An event that occurs when sigflow reconstructs a smb flow and logged its metadata.

[sigflow_alert_smb]
search = (sourcetype=gw:gcenter:101:sigflow:alert event_type=alert app_proto=smb)
description = An event that occurs when sigflow reconstructs a smb flow and one of its rules matched the content of this flow.
color = et_red

[sigflow_meta_smtp]
search = (sourcetype=gw:gcenter:101:sigflow:meta event_type=smtp)
description = An event that occurs when sigflow reconstructs a smtp flow and logged its metadata.

[sigflow_alert_smtp]
search = (sourcetype=gw:gcenter:101:sigflow:alert event_type=alert app_proto=smtp)
description = An event that occurs when sigflow reconstructs a smtp flow and one of its rules matched the content of this flow.
color = et_red

[sigflow_meta_ssh]
search = (sourcetype=gw:gcenter:101:sigflow:meta event_type=ssh)
description = An event that occurs when sigflow reconstructs a ssh flow and logged its metadata.

[sigflow_alert_ssh]
search = (sourcetype=gw:gcenter:101:sigflow:alert event_type=alert app_proto=ssh)
description = An event that occurs when sigflow reconstructs a ssh flow and one of its rules matched the content of this flow.
color = et_red

[sigflow_meta_tftp]
search = (sourcetype=gw:gcenter:101:sigflow:meta event_type=tftp)
description = An event that occurs when sigflow reconstructs a tftp flow and logged its metadata.

[sigflow_alert_tftp]
search = (sourcetype=gw:gcenter:101:sigflow:alert event_type=alert app_proto=tftp)
description = An event that occurs when sigflow reconstructs a tftp flow and one of its rules matched the content of this flow.
color = et_red

[sigflow_meta_tls]
search = (sourcetype=gw:gcenter:101:sigflow:meta event_type=tls)
description = An event that occurs when sigflow reconstructs a tls flow and logged its metadata.

[sigflow_alert_tls]
search = (sourcetype=gw:gcenter:101:sigflow:alert event_type=alert app_proto=tls)
description = An event that occurs when sigflow reconstructs a tls flow and one of its rules matched the content of this flow.
color = et_red

[sigflow_unknown_alert]
search = (sourcetype=gw:gcenter:101:sigflow* event_type=alert (app_proto=failed OR NOT app_proto=*))
description = An event that occurs when sigflow reconstructs the flow of an unknown protocol, and one of its rules matched the content of this flow.
color = et_red

[sigflow_other]
search = (sourcetype=gw:gcenter:101:sigflow* type=suricata NOT event_type IN (netflow,fileinfo,alert,dcerpc,dhcp,dnp3,dns,ftp,http,ikev2,krb5,modbus,nfs,ntp,smb,smtp,ssh,tftp,tls))
description = An event that occurs when sigflow reconstructs the flow of a protocol not expected by this add-on.
color = et_blue
Events related to the DGA DETECT machine learning engine:
[dgadetect_clean]
search = (sourcetype=gw:gcenter:101:sigflow:meta dga_probability=* severity=0)
description = An event that occurs when dgadetect find that a domain name is not suspicious (likeky not generated by a Domain Generation Algorithm). This eventtype overlaps the sigflow:dns:meta eventtype.

[dgadetect_suspicious]
search = (sourcetype=gw:gcenter:101:sigflow:meta dga_probability=* severity=1)
description = An event that occurs when dgadetect finds that a domain name is suspicious (likely generated by a Domain Generation Algorithm).
color = et_red
Codebreaker engine related events:
[codebreaker_shellcode_expoit]
search = (sourcetype=gw:gcenter:101:codebreaker type=codebreaker event_type=shellcode state=Exploit)
description = An event that occurs when codebreaker detects a shellcode.
color = et_red

[codebreaker_shellcode_suspicious]
search = (sourcetype=gw:gcenter:101:codebreaker type=codebreaker event_type=shellcode state=Suspicious)
description = An event that occurs when codebreaker suspects it has potentially detected a shellcode.
color = et_orange

[codebreaker_shellcode_other]
search = (sourcetype=gw:gcenter:101:codebreaker type=codebreaker event_type=shellcode NOT state IN ('Suspicious','Exploit'))
description = An event that occurs when codebreaker returns a code indicating an exception or a failure in its shellcode analysis.
color = et_blue

[codebreaker_powershell_expoit]
search = (sourcetype=gw:gcenter:101:codebreaker type=codebreaker event_type=powershell state=Exploit)
description = An event that occurs when codebreaker detects an exploit in a powershell.
color = et_red

[codebreaker_powershell_suspicious]
search = (sourcetype=gw:gcenter:101:codebreaker type=codebreaker event_type=powershell state=Suspicious)
description = An event that occurs when codebreaker suspects it has potentially detected a suspicious powershell.
color = et_orange

[codebreaker_powershell_other]
search = (sourcetype=gw:gcenter:101:codebreaker type=codebreaker event_type=powershell NOT state IN ('Suspicious','Exploit'))
description = An event that occurs when codebreaker returns a code indicating an exception or a failure in its powershell analysis.
color = et_blue