8.6.2. Export des données vers un SIEM SPLUNK via le protocole syslog
8.6.2.1. Introduction
sur le GCenter, configurer l'export de données :
sur le serveur Splunk, installer le TA compatible avec la version du GCenter installé (exemple le TA-gatewatcher-gcenter-v102 pour la V102 du GCenter) (voir la Procédure à effectuer sur le serveur SPLUNK)
sur le serveur Splunk, configurer la réception des données en provenance du GCenter et les associer au TA (voir la Procédure de configuration de la réception des données)
Note
Note
8.6.2.2. Prérequis
Utilisateur : membre du groupe Administrator
8.6.2.3. Opérations préliminaires
Se connecter au GCenter via un navigateur (voir la Connexion à l'interface web du GCenter via un navigateur internet).
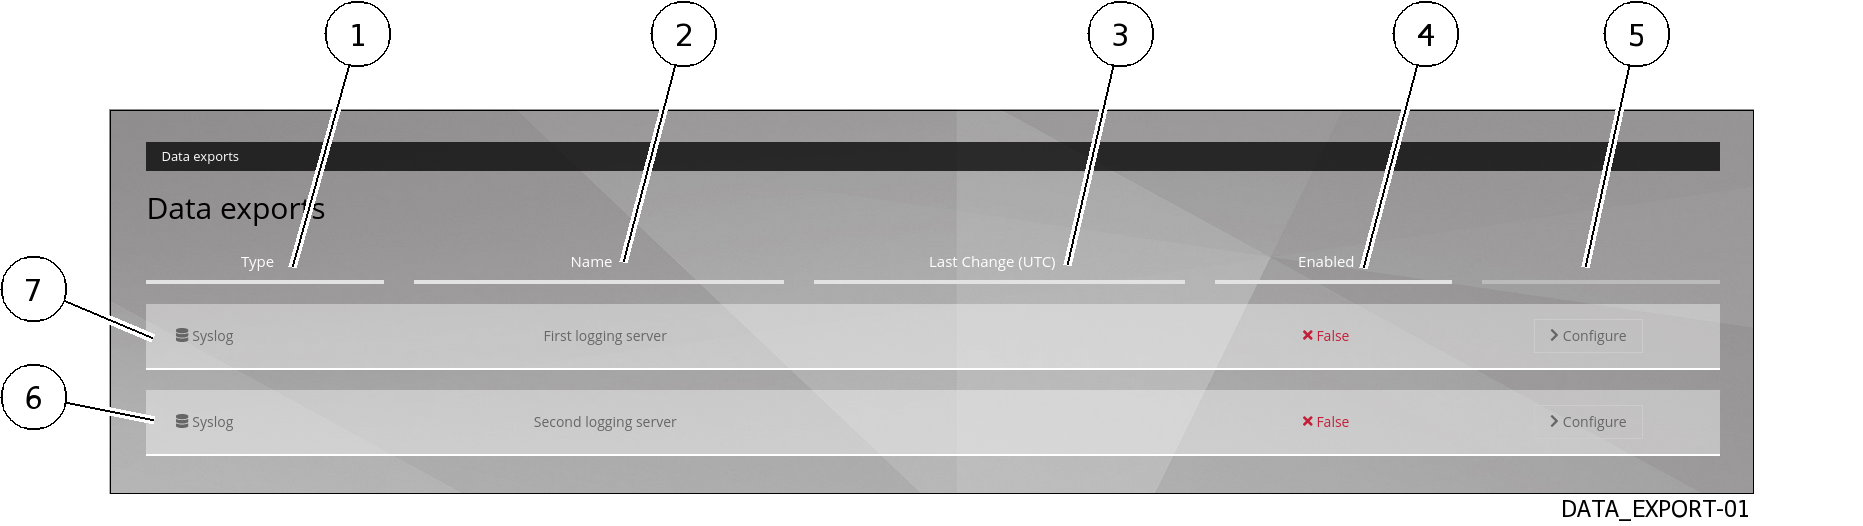
8.6.2.4. Procédure d’accès à la fenêtre `Data exports` pour un compte de type administrator
Dans la barre de navigation, cliquer successivement sur :
le bouton
`Admin`le sous menu
`Gcenter`- la commande
`Data exports`La fenêtre`Data exports`est affichée.
8.6.2.5. Procédure de configuration des paramètres généraux
- Cliquer sur le bouton
`Configure`(5) sur l'un des deux connexions (6 ou 7) à configurer.La fenêtre`Syslog data export`s'ouvre.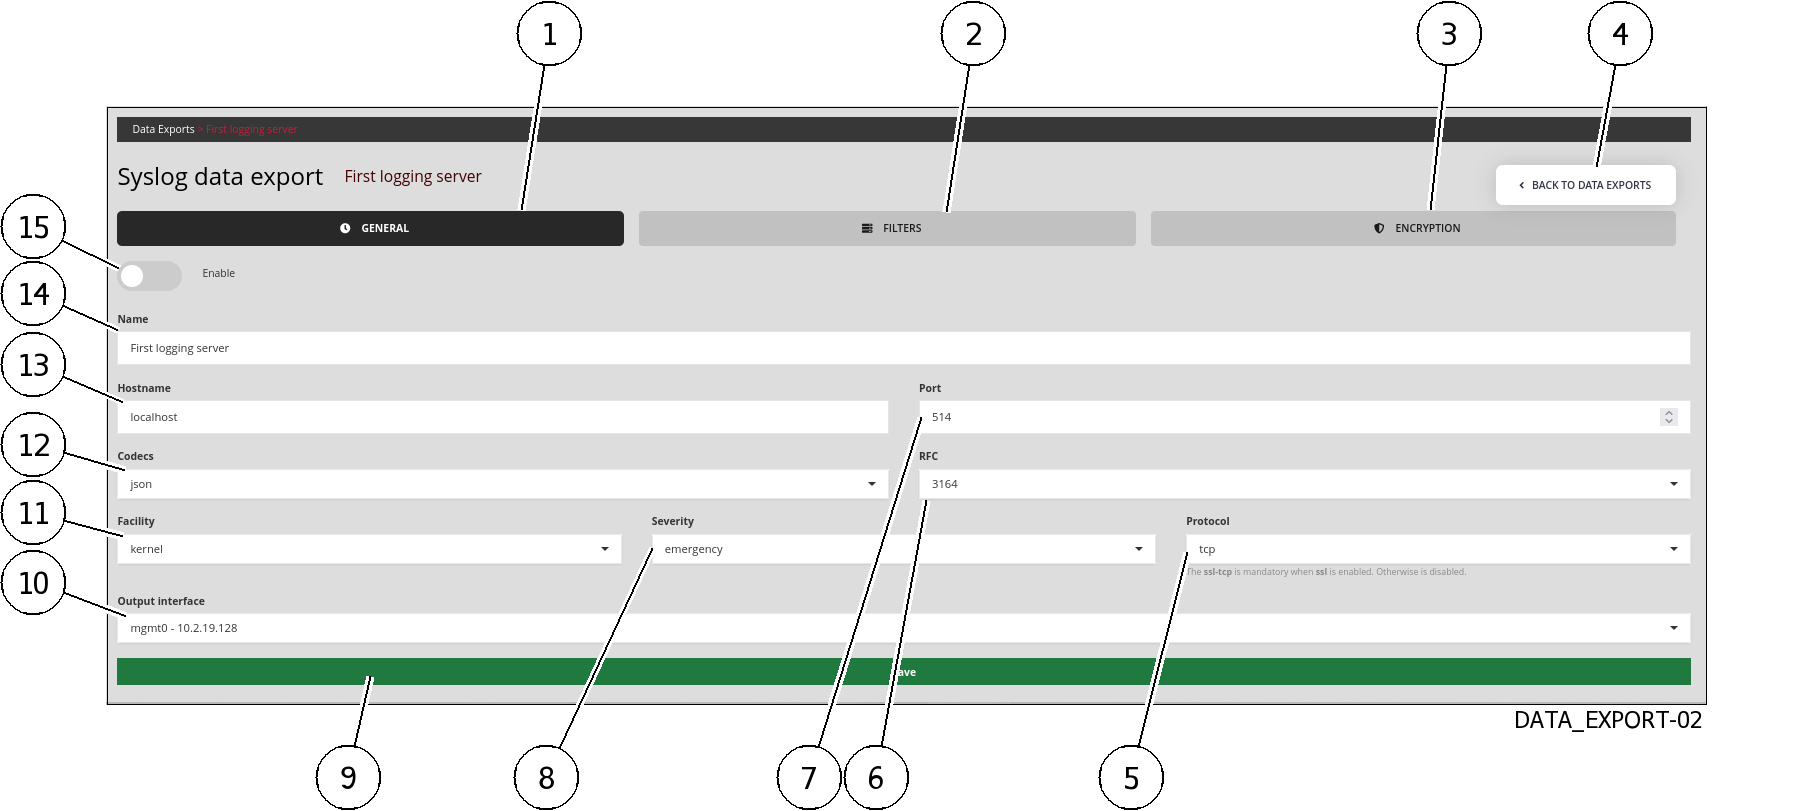
Cliquer sur l'onglet (1)
`GENERAL`.
Note
Les valeurs dont le format est de type $VALEUR sont spécifiques au contexte et sont notées comme telles afin qu'il puisse y être fait référence dans la suite de la documentation.
Saisir les paramètres à l'aide du tableau suivant :
Item
Paramètre
Description
Valeur
15
Enable
Activer ce pipeline d'export
Activé
14
Name
Nom de l'export Syslog
$SYSLOG_NAME
13
Hostname
Nom DNS ou adresse IP du serveur Splunk
$SPLUNK_IP
7
Port
Port de destination du flux Syslog
$SYSLOG_PORT
12
Codecs
Codec utilisé pour l'export
JSON
6
RFC
Norme utilisée par le codec
3164
11
Facility
Valeur de
`facility`dans l'en-tête Syslogkernel par défaut ; l'en-tête sera supprimé par le TA Splunk
8
Severity
Valeur de
`severity`dans l'en-tête Syslogemergency par défaut ; l'en-tête sera supprimé par le TA Splunk
5
Protocol
Le protocole de transport utilisé. TCP ou UDP peuvent être utilisés
$PROTOCOL
10
Output interface
Choisir l'interface du GCenter utilisée pour l'export Syslog
$GCENTER_IFACE
- Valider en utilisant le bouton (9)
`Save`.Le message suivant indique que la mise à jour a été effectuée :`Updated with success`.
8.6.2.6. Procédure de configuration des paramètres de filtration
Cliquer sur l'onglet (2)
`FILTERS`.
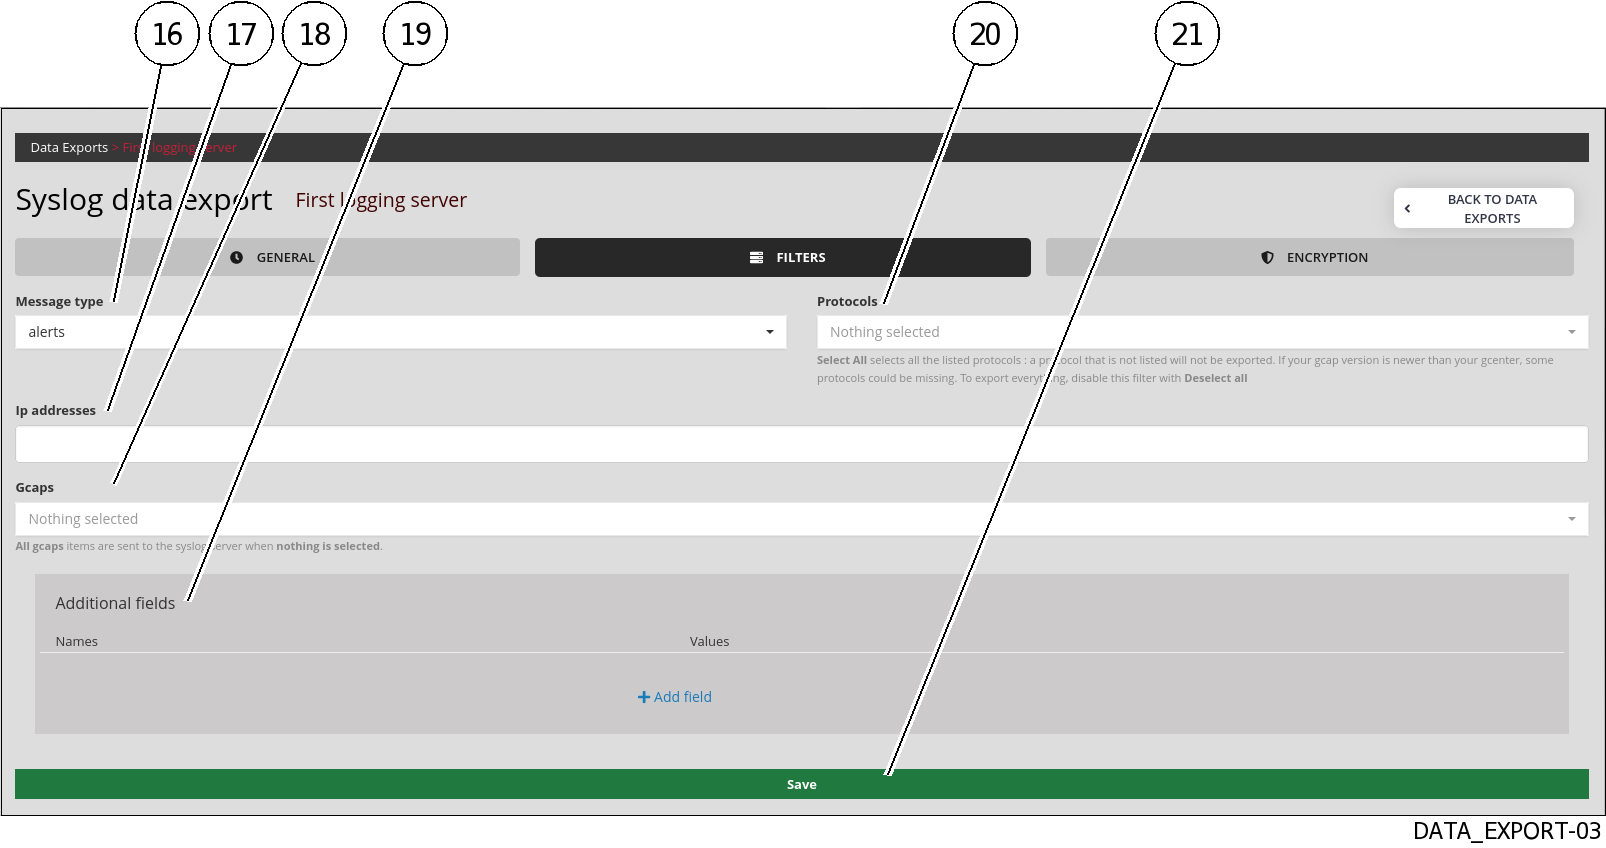
Saisir les paramètres à l'aide du tableau suivant :
Item
Paramètre
Description
16
`Message type`Définit le type d’événement à envoyer au serveur distant. Soit uniquement les alertes, soit les alertes et les métadonnées (Exemple : alerts, all)
17
`Ip addresses`Filtre par IP ou réseaux. Par défaut, toutes les données sont envoyés au serveur distant si le champ est vide
18
`Gcaps`Filtre par Gcap. Par défaut, toutes les données des GCap appairés au GCenter sont envoyés au serveur distant si rien n'est sélectionné (Exemple : GCap1, GCap2)
19
`Additional fields``Name`) et une description (`Values`) peuvent être renseignés dans cette fenêtre.Dans le cas de l'utilisation du codec idmef, ce champ n'est pas supporté.20
`Protocols`21
`Save`La prise en compte des modifications n'est effective qu'après avoir appuyé sur le bouton
`Save`Note
`Select All`sélectionne tous les protocoles listés : un protocole qui n'est pas sélectionné ne sera pas exporté.Si la version du GCap est plus récente que celle du GCenter, certains protocoles peuvent manquer.Pour tout exporter, désactivez ce filtre avec`Deselect all`.
- Valider en utilisant le bouton (21)
`Save`.Le message suivant indique que la mise à jour a été effectuée :`Updated with success`.
8.6.2.7. Procédure de configuration des paramètres du chiffrement
Cliquer sur l'onglet (3)
`ENCRYPTION`.
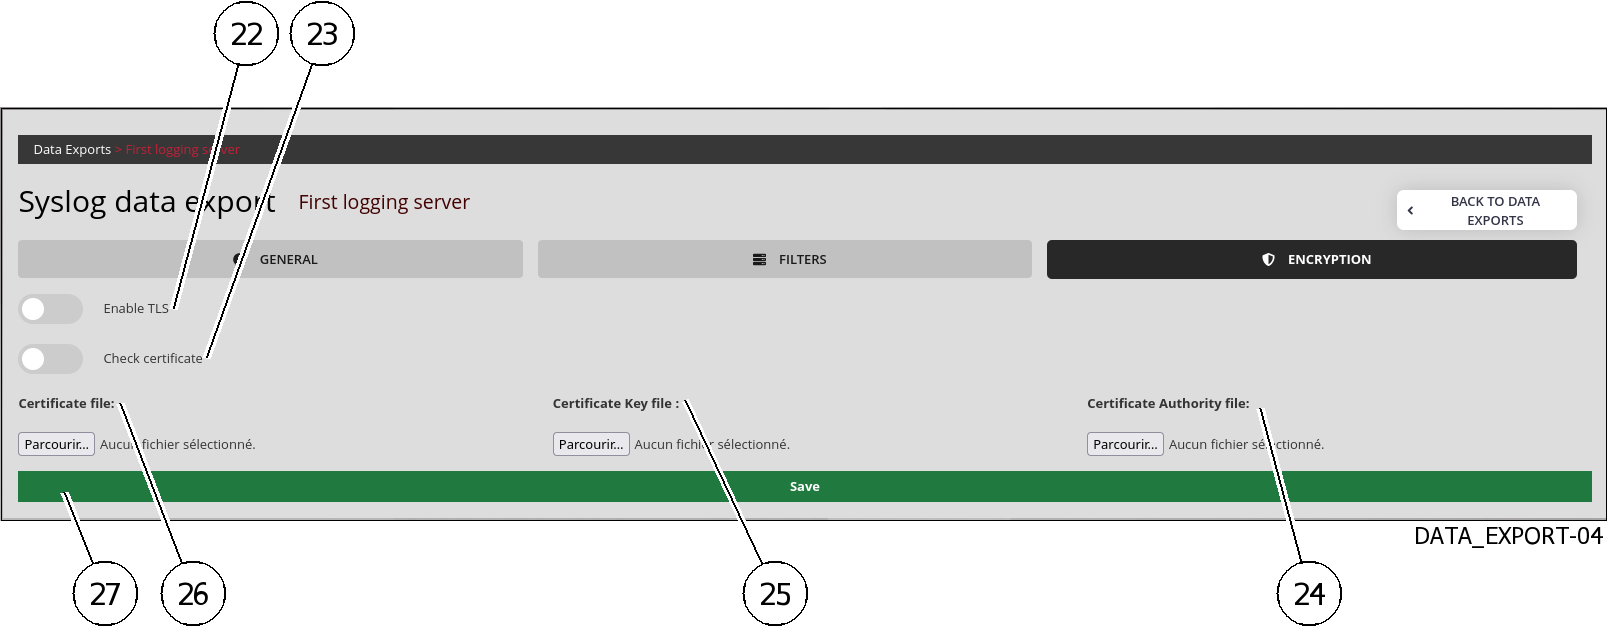
Saisir les paramètres à l'aide du tableau suivant :
Item
Paramètre
Description
22
`Enable TLS`Active le service TLS (Transport Layer Security). Désactivée par défaut
23
`Check certificate`Vérifie la validité du certificat lorsque le service TLS est activé. Désactivée par défaut.
24
`Certificate file`Ajoute un certificat
25
`Certificate Key file`Ajoute la clé associée
26
`Certificate Authority file`Ajoute le fichier concernant l'autorité de certification
27
`Save`La prise en compte des modifications n'est effective qu'après avoir appuyé sur le bouton
`Save`
- Valider en utilisant le bouton (27)
`Save`.Le message suivant indique que la mise à jour a été effectuée :`Updated with success`.
8.6.2.7.1. Procédure à effectuer sur le serveur SPLUNK
Contacter le support de Gatewatcher pour obtenir le fichier TA-gatewatcher-gcenter-v10x.spl correspondant à la version du GCenter.
Note
Le TA Splunk est encore en version bêta. Le contenu du TA est détaillé à la fin de cette procédure afin que les administrateurs puissent l'adapter à leurs besoins.
L'installation du TA se fait comme pour toute app Splunk.Les étapes sont les suivantes (consulter la documentation relative à la version utilisée de Splunk pour plus de détails) :
Dans le menu :
gérer les apps
installer une application depuis un fichier
choisir le TA Gatewatcher
cliquer sur le bouton
`Envoyer`
Dans le menu de gestion des apps Splunk, en cliquant sur "Afficher les objets", il est possible d'accéder à l'ensemble des objets apportés par le TA :
la définition des alias de champ
la définition des eventtypes
les associations entre eventtype et tags
Il est possible d'activer/désactiver les objets depuis cette interface et modifier leurs permissions (par défaut, les permissions sont à "Global" - Lecture pour tout le monde - Écriture pour les admins seulement).
8.6.2.7.2. Procédure de configuration de la réception des données
Paramètre
Description
Valeur
TCP/UDP
Protocole de transport utilisé
Doit être égal à $PROTOCOL
Port
Port d'écoute sur le serveur Splunk
Doit être égal à $SYSLOG_PORT
Sourcetype
Sourcetype assigné au flux reçu
gw:gcenter:101
Contexte de l'app
App dans laquelle le fichier input.conf relatif à cette entrée sera placé
TA-gatewatcher-gcenter-101
Index
Index dans lequel les données reçues seront écrites
Selon l'architecture de données, il est possible d'utiliser un index spécifique pour les logs de Gatewatcher
8.6.2.7.3. Composition du Technological Add-On (TA)
Un Technological Add-On (TA) ,développé par Gatewatcher, permet de mapper les données exportés par le GCenter vers les modèles de données Splunk.
Note
Note
8.6.2.7.3.1. Fichier props.conf
Note
Cet exemple est basé sur la version V101.
[gw:gcenter:101]
KV_MODE = json
MAX_TIMESTAMP_LOOKAHEAD = 31
La section suivante supprime les en-têtes Syslog et le champ @version d'elasticsearch, qui n'est pas utilisé.
SEDCMD-gw-1-remove-header = s/^([^\{]+)//
SEDCMD-gw-2-remove-host = s/\"host\":\"[^\s"]+\",?//
SEDCMD-gw-3-remove-version = s/\"@version\":\"[^\s"]+\",?//
SEDCMD-gw-4-remove-trailing_comma = s/,}/}/
TIME_FORMAT = %Y-%m-%dT%H:%M:%S.%6N%Z
TIME_PREFIX = \"timestamp_detected\":\"
La transformation suivante appelle gw_force_host dans transforms.conf, et permet d'associer le nom du GCenter au champ host utilisé par Splunk.
TRANSFORMS-host = gw_force_host
La transformation suivante appelle les stanzas sourcetype_* de transforms.conf afin d'associer un sourcetype en fonction du moteur qui a généré le log.
TRANSFORMS-override_sourcetype_engine = sourcetype_malcore,sourcetype_codebreaker,sourcetype_sigflow,sourcetype_sigflow_alert
Les logs ne peuvent pas dépasser 65 ko, les GCenters sont en UTC.
TRUNCATE = 65535
TZ = UTC
category = Splunk App Add-on Builder
pulldown_type = 1
La suite de props.conf permet d'associer à chaque sourcetype les alias de champ et les évaluations de champ permettant de transformer les logs pour les faire correspondre aux modèles de données.
[gw:gcenter:101:sigflow:meta]
FIELDALIAS-gw_gcenter_101_sigflow_meta_src = src_ip AS src
FIELDALIAS-gw_gcenter_101_sigflow_meta_dest = dest_ip AS dest
FIELDALIAS-gw_gcenter_101_sigflow_meta_hash = fileinfo.sha256 AS file_hash
FIELDALIAS-gw_gcenter_101_sigflow_meta_alias_1 = tcp.tcp_flags AS tcp_flag
FIELDALIAS-gw_gcenter_101_sigflow_meta_alias_2 = netflow.pkts AS packets
FIELDALIAS-gw_gcenter_101_sigflow_meta_alias_3 = netflow.bytes AS bytes
FIELDALIAS-gw_gcenter_101_sigflow_meta_alias_4 = event_type AS app

FIELDALIAS-gw_gcenter_101_sigflow_meta_http_alias_02 = http.status AS status
FIELDALIAS-gw_gcenter_101_sigflow_meta_http_alias_03 = http.length AS bytes
FIELDALIAS-gw_gcenter_101_sigflow_meta_http_alias_04 = http.url AS uri_query
FIELDALIAS-gw_gcenter_101_sigflow_meta_http_alias_05 = http.hostname AS url_domain
FIELDALIAS-gw_gcenter_101_sigflow_meta_http_alias_06 = http.http_content_type AS http_content_type
FIELDALIAS-gw_gcenter_101_sigflow_meta_http_alias_07 = http.http_method AS http_method
FIELDALIAS-gw_gcenter_101_sigflow_meta_http_alias_08 = http.http_user_agent AS http_user_agent
FIELDALIAS-gw_gcenter_101_sigflow_meta_http_alias_09 = http.http_refer AS http_referrer

EVAL-action = "allowed"
EVAL-protocol = "ip"
EVAL-transport = lower(proto)
EVAL-url = url_domain+uri_query

[gw:gcenter:101:sigflow:alert]
EVAL-action = "allowed"
EVAL-transport = low(proto)
FIELDALIAS-gw_gcenter_101_sigflow_alert_alias_1 = src_ip AS src
FIELDALIAS-gw_gcenter_101_sigflow_alert_alias_2 = dest_ip AS dest
FIELDALIAS-gw_gcenter_101_sigflow_alert_alias_3 = alert.signature AS signature
FIELDALIAS-gw_gcenter_101_sigflow_alert_alias_4 = alert.signature_id AS signature_id
FIELDALIAS-gw_gcenter_101_sigflow_alert_alias_5 = severity AS severity_id

[gw:gcenter:101:malcore]
FIELDALIAS-gw_gcenter_101_malcore_src = src_ip AS src
FIELDALIAS-gw_gcenter_101_malcore_dest = dest_ip AS dest
FIELDALIAS-gw_gcenter_101_malcore_hash = SHA256 AS file_hash
FIELDALIAS-gw_gcenter_101_malcore_alias_2 = src_ip AS src
FIELDALIAS-gw_gcenter_101_malcore_alias_3 = dest_ip AS dest
FIELDALIAS-gw_gcenter_101_malcore_alias_4 = filename AS file_name
FIELDALIAS-gw_gcenter_101_malcore_alias_5 = http_uri AS file_path
FIELDALIAS-gw_gcenter_101_malcore_alias_6 = total_found AS signature_id

[gw:gcenter:101:codebreaker]
FIELDALIAS-gw_gcenter_101_codebreaker_src = src_ip AS src
FIELDALIAS-gw_gcenter_101_codebreaker_dest = dest_ip AS dest
FIELDALIAS-gw_gcenter_101_codebreaker_hash = SHA256 AS file_hash
FIELDALIAS-gw_gcenter_101_codebreaker_alias_4 = event_type AS category
8.6.2.7.3.2. Fichier transforms.conf
Note
Cet exemple est basé sur la version V101.
Les stanzas présentes dans ce fichier sont utilisées par props.conf et concernent les champs indexés par Splunk, comme host ou sourcetype.
[gw_force_host]
LOOKAHEAD = 65535
DEST_KEY = MetaData:Host
REGEX = \"GCenter\"\:\"([^\"]+)
FORMAT = host::$1

[sourcetype_malcore]
LOOKAHEAD = 65535
REGEX = \"type\"\:\"malcore\"
FORMAT = sourcetype::gw:gcenter:101:malcore
DEST_KEY = MetaData:Sourcetype

[sourcetype_codebreaker]
LOOKAHEAD = 65535
REGEX = \"type\"\:\"codebreaker\"
FORMAT = sourcetype::gw:gcenter:101:codebreaker
DEST_KEY = MetaData:Sourcetype

[sourcetype_sigflow]
LOOKAHEAD = 65535
REGEX = \"type\"\:\"suricata\"
FORMAT = sourcetype::gw:gcenter:101:sigflow:meta
DEST_KEY = MetaData:Sourcetype

[sourcetype_sigflow_alert]
LOOKAHEAD = 65535
REGEX = \"event_type\"\:\"alert\"
FORMAT = sourcetype::gw:gcenter:101:sigflow:alert
DEST_KEY = MetaData:Sourcetype
8.6.2.7.3.3. Fichier eventtype.conf
Note
Cet exemple est basé sur la version V101.
[malcore_clean]
search = (sourcetype=gw:gcenter:101:malcore event_type=malware retroact="None" code=0 )
description = An event that occurs when malcore analyses a file and none of the engines detects a threat

[malcore_infected]
search = (sourcetype=gw:gcenter:101:malcore event_type=malware retroact="None" code=1)
description = An event that occurs when malcore analyses a file and at least one of the engines detects a threat
color = et_red

[malcore_suspicious]
search = (sourcetype=gw:gcenter:101:malcore event_type=malware retroact="None" code=2)
description = An event that occurs when malcore analyses a file, none of the engines detects a threat but at least one classifies the file as suspicious. Suspicious files can be analysed lated by retroact, if enabled.
color = et_orange

[malcore_other]
search = (sourcetype=gw:gcenter:101:malcore event_type=malware retroact="None" NOT code IN (0,1,2))
description = An event that occurs when malcore returns a code indicating an exception or a failure in the analysis.
color = et_blue
Événements relatifs à la réanalyse antivirale des fichiers "suspicious" (retroact) :
[retroact_clean]
search = (sourcetype=gw:gcenter:101:malcore event_type=malware retroact!="None" code=0 )
description = An event that occurs when retroact analyses a file and none of the engines detects a threat
color = et_blue

[retroact_infected]
search = (sourcetype=gw:gcenter:101:malcore event_type=malware retroact!="None" code=2)
description = An event that occurs when retroact analyses a file and at least one of the engines detects a threat
color = et_red

[retroact_suspicious]
search = (sourcetype=gw:gcenter:101:malcore event_type=malware retroact!="None" code=2)
description = An event that occurs when retroact analyses a file, none of the engines detects a threat but at least one classifies the file as suspicious. Suspicious files can be analysed lated by retroact, if enabled.
color = et_orange

[retroact_other]
search = (sourcetype=gw:gcenter:101:malcore event_type=malware retroact!="None" NOT code IN (0,1,2))
description = An event that occurs when retroact returns a code indicating an exception or a failure in the analysis.
color = et_blue
Événement relatif à l'activation du logging netflow sur le GCap :
[sigflow_netflow]
search = (sourcetype=gw:gcenter:101:sigflow:meta event_type=netflow)
description = An event that occurs when sigflow generates a netflow event from a network event.
- Événements relatifs à la reconstruction de fichiers par le GCap :
[sigflow_fileinfo_stored]
search = (sourcetype=gw:gcenter:101:sigflow:meta event_type=fileinfo fileinfo.stored="true")
description = An event that occurs when sigflow has performed a file reconstruction and based on its ruleset, has stored it on disk to perform malcore analysis afterwards.
color = et_blue

[sigflow_fileinfo_not_stored]
search = (sourcetype=gw:gcenter:101:sigflow:meta event_type=fileinfo fileinfo.stored="false")
description = An event that occurs when sigflow has performed a file reconstruction and based on its ruleset, has not stored it on disk.
Les événements relatifs au moteur Sigflow peuvent être de deux types pour chaque protocole :
Événement "meta" : génération de métadonnées, obtenues par l'activation du logging du protocole sur le GCap.
Événement "alert" : génération d'une alerte, obtenues par l'activation du parsing du protocole sur le GCap, et la correspondance entre un flux et une règle sigflow.
[sigflow_meta_dcerpc]
search = (sourcetype=gw:gcenter:101:sigflow:meta event_type=dcerpc)
description = An event that occurs when sigflow has reconstructed a dcerpc flow and has logged its metadata.

[sigflow_alert_dcerpc]
search = (sourcetype=gw:gcenter:101:sigflow:alert event_type=alert app_proto=dcerpc)
description = An event that occurs when sigflow has reconstructed a dcerpc flow and that one of its rules matched the content of this flow.
color = et_red

[sigflow_meta_dhcp]
search = (sourcetype=gw:gcenter:101:sigflow:meta event_type=dhcp)
description = An event that occurs when sigflow has reconstructed a dhcp flow and has logged its metadata.

[sigflow_alert_dhcp]
search = (sourcetype=gw:gcenter:101:sigflow:alert event_type=alert app_proto=dhcp)
description = An event that occurs when sigflow has reconstructed a dhcp flow and that one of its rules matched the content of this flow.
color = et_red

[sigflow_meta_dnp3]
search = (sourcetype=gw:gcenter:101:sigflow:meta event_type=dnp3)
description = An event that occurs when sigflow has reconstructed a dnp3 flow and has logged its metadata.

[sigflow_alert_dnp3]
search = (sourcetype=gw:gcenter:101:sigflow:alert event_type=alert app_proto=dnp3)
description = An event that occurs when sigflow has reconstructed a dnp3 flow and that one of its rules matched the content of this flow.
color = et_red

[sigflow_meta_dns]
search = (sourcetype=gw:gcenter:101:sigflow:meta event_type=dns)
description = An event that occurs when sigflow has reconstructed a dns flow and has logged its metadata.
priority = 2

[sigflow_alert_dns]
search = (sourcetype=gw:gcenter:101:sigflow:alert event_type=alert app_proto=dns)
description = An event that occurs when sigflow has reconstructed a dns flow and that one of its rules matched the content of this flow.
color = et_red

[sigflow_meta_ftp]
search = (sourcetype=gw:gcenter:101:sigflow:meta event_type=ftp)
description = An event that occurs when sigflow has reconstructed a ftp flow and has logged its metadata.

[sigflow_alert_ftp]
search = (sourcetype=gw:gcenter:101:sigflow:alert event_type=alert app_proto=ftp)
description = An event that occurs when sigflow has reconstructed a ftp flow and that one of its rules matched the content of this flow.
color = et_red

[sigflow_meta_http]
search = (sourcetype=gw:gcenter:101:sigflow:meta event_type=http)
description = An event that occurs when sigflow has reconstructed a http flow and has logged its metadata.

[sigflow_alert_http]
search = (sourcetype=gw:gcenter:101:sigflow:alert event_type=alert app_proto=http)
description = An event that occurs when sigflow has reconstructed a http flow and that one of its rules matched the content of this flow.
color = et_red

[sigflow_meta_ikev2]
search = (sourcetype=gw:gcenter:101:sigflow:meta event_type=ikev2)
description = An event that occurs when sigflow has reconstructed a ikev2 flow and has logged its metadata.

[sigflow_alert_ikev2]
search = (sourcetype=gw:gcenter:101:sigflow:alert event_type=alert app_proto=ikev2)
description = An event that occurs when sigflow has reconstructed a ikev2 flow and that one of its rules matched the content of this flow.
color = et_red

[sigflow_meta_krb5]
search = (sourcetype=gw:gcenter:101:sigflow:meta event_type=krb5)
description = An event that occurs when sigflow has reconstructed a krb5 flow and has logged its metadata.

[sigflow_alert_krb5]
search = (sourcetype=gw:gcenter:101:sigflow:alert event_type=alert app_proto=krb5)
description = An event that occurs when sigflow has reconstructed a krb5 flow and that one of its rules matched the content of this flow.
color = et_red

[sigflow_meta_modbus]
search = (sourcetype=gw:gcenter:101:sigflow:meta event_type=modbus)
description = An event that occurs when sigflow has reconstructed a modbus flow and has logged its metadata.

[sigflow_alert_modbus_alert]
search = (sourcetype=gw:gcenter:101:sigflow:alert event_type=alert app_proto=modbus)
description = An event that occurs when sigflow has reconstructed a modbus flow and that one of its rules matched the content of this flow.
color = et_red

[sigflow_meta_nfs]
search = (sourcetype=gw:gcenter:101:sigflow:meta event_type=nfs)
description = An event that occurs when sigflow has reconstructed a nfs flow and has logged its metadata.

[sigflow_alert_nfs]
search = (sourcetype=gw:gcenter:101:sigflow:alert event_type=alert app_proto=nfs)
description = An event that occurs when sigflow has reconstructed a nfs flow and that one of its rules matched the content of this flow.
color = et_red

[sigflow_meta_ntp]
search = (sourcetype=gw:gcenter:101:sigflow:meta event_type=ntp)
description = An event that occurs when sigflow has reconstructed a ntp flow and has logged its metadata.

[sigflow_alert_ntp]
search = (sourcetype=gw:gcenter:101:sigflow:alert event_type=alert app_proto=ntp)
description = An event that occurs when sigflow has reconstructed a ntp flow and that one of its rules matched the content of this flow.
color = et_red

[sigflow_meta_smb]
search = (sourcetype=gw:gcenter:101:sigflow:meta event_type=smb)
description = An event that occurs when sigflow has reconstructed a smb flow and has logged its metadata.

[sigflow_alert_smb]
search = (sourcetype=gw:gcenter:101:sigflow:alert event_type=alert app_proto=smb)
description = An event that occurs when sigflow has reconstructed a smb flow and that one of its rules matched the content of this flow.
color = et_red

[sigflow_meta_smtp]
search = (sourcetype=gw:gcenter:101:sigflow:meta event_type=smtp)
description = An event that occurs when sigflow has reconstructed a smtp flow and has logged its metadata.

[sigflow_alert_smtp]
search = (sourcetype=gw:gcenter:101:sigflow:alert event_type=alert app_proto=smtp)
description = An event that occurs when sigflow has reconstructed a smtp flow and that one of its rules matched the content of this flow.
color = et_red

[sigflow_meta_ssh]
search = (sourcetype=gw:gcenter:101:sigflow:meta event_type=ssh)
description = An event that occurs when sigflow has reconstructed a ssh flow and has logged its metadata.

[sigflow_alert_ssh]
search = (sourcetype=gw:gcenter:101:sigflow:alert event_type=alert app_proto=ssh)
description = An event that occurs when sigflow has reconstructed a ssh flow and that one of its rules matched the content of this flow.
color = et_red

[sigflow_meta_tftp]
search = (sourcetype=gw:gcenter:101:sigflow:meta event_type=tftp)
description = An event that occurs when sigflow has reconstructed a tftp flow and has logged its metadata.

[sigflow_alert_tftp]
search = (sourcetype=gw:gcenter:101:sigflow:alert event_type=alert app_proto=tftp)
description = An event that occurs when sigflow has reconstructed a tftp flow and that one of its rules matched the content of this flow.
color = et_red

[sigflow_meta_tls]
search = (sourcetype=gw:gcenter:101:sigflow:meta event_type=tls)
description = An event that occurs when sigflow has reconstructed a tls flow and has logged its metadata.

[sigflow_alert_tls]
search = (sourcetype=gw:gcenter:101:sigflow:alert event_type=alert app_proto=tls)
description = An event that occurs when sigflow has reconstructed a tls flow and that one of its rules matched the content of this flow.
color = et_red

[sigflow_unknown_alert]
search = (sourcetype=gw:gcenter:101:sigflow* event_type=alert (app_proto=failed OR NOT app_proto=*))
description = An event that occurs when sigflow has reconstructed the flow of an unknown protocol, and that one of its rules matched the content of this flow.
color = et_red

[sigflow_other]
search = (sourcetype=gw:gcenter:101:sigflow* type=suricata NOT event_type IN (netflow,fileinfo,alert,dcerpc,dhcp,dnp3,dns,ftp,http,ikev2,krb5,modbus,nfs,ntp,smb,smtp,ssh,tftp,tls))
description = An event that occurs when sigflow has reconstructed the flow of a protocol not expected by this add-on.
color = et_blue
Événements relatifs au moteur de Machine Learning DGA DETECT :
[dgadetect_clean]
search = (sourcetype=gw:gcenter:101:sigflow:meta dga_probability=* severity=0)
description = An event that occurs when dgadetect find that a domain name is not suspicious (likeky not generated by a Domain Generation Algorithm). This eventtype overlap the sigflow:dns:meta eventtype.

[dgadetect_suspicious]
search = (sourcetype=gw:gcenter:101:sigflow:meta dga_probability=* severity=1)
description = An event that occurs when dgadetect find that a domain name is suspicious (likeky generated by a Domain Generation Algorithm).
color = et_red
Événements relatifs au moteur Codebreaker :
[codebreaker_shellcode_expoit]
search = (sourcetype=gw:gcenter:101:codebreaker type=codebreaker event_type=shellcode state=Exploit)
description = An event that occurs when codebreaker has detected a shellcode.
color = et_red

[codebreaker_shellcode_suspicious]
search = (sourcetype=gw:gcenter:101:codebreaker type=codebreaker event_type=shellcode state=Suspicious)
description = An event that occurs when codebreaker suspects it has potentially detected a shellcode.
color = et_orange

[codebreaker_shellcode_other]
search = (sourcetype=gw:gcenter:101:codebreaker type=codebreaker event_type=shellcode NOT state IN ('Suspicious','Exploit'))
description = An event that occurs when codebreaker returns a code indicating an exception or a failure in its shellcode analysis.
color = et_blue

[codebreaker_powershell_expoit]
search = (sourcetype=gw:gcenter:101:codebreaker type=codebreaker event_type=powershell state=Exploit)
description = An event that occurs when codebreaker has detected an exploit in a powershell.
color = et_red

[codebreaker_powershell_suspicious]
search = (sourcetype=gw:gcenter:101:codebreaker type=codebreaker event_type=powershell state=Suspicious)
description = An event that occurs when codebreaker suspects it has potentially detected a suspicious powershell.
color = et_orange

[codebreaker_powershell_other]
search = (sourcetype=gw:gcenter:101:codebreaker type=codebreaker event_type=powershell NOT state IN ('Suspicious','Exploit'))
description = An event that occurs when codebreaker returns a code indicating an exception or a failure in its powershell analysis.
color = et_blue