8.6.2. Configuring the export data to ETL Logstash via the syslog protocol
8.6.2.1. Introduction
On the GCenter, configure data export, see Procedure to set the data export #1 settings
On the Logstash server, configure the flow receiving pipeline from the GCenter (see Procedure to be performed on the server)
Note
8.6.2.2. Prerequisites
User: member of Administrator group
8.6.2.3. Preliminary operations
Login to GCenter via a browser (see Connecting to the GCenter web interface via a web browser)
8.6.2.4. Procedure to access the `Data export` window
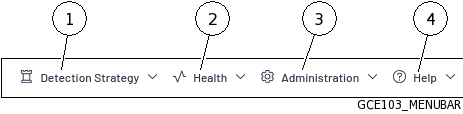
In the GCenter interface, click on the
`Administration`menu (3).- Click on the
`Log export`command from the`Data`submenu.The`Data export`window is displayed.
8.6.2.5. Procedure to set the data export #1 settings
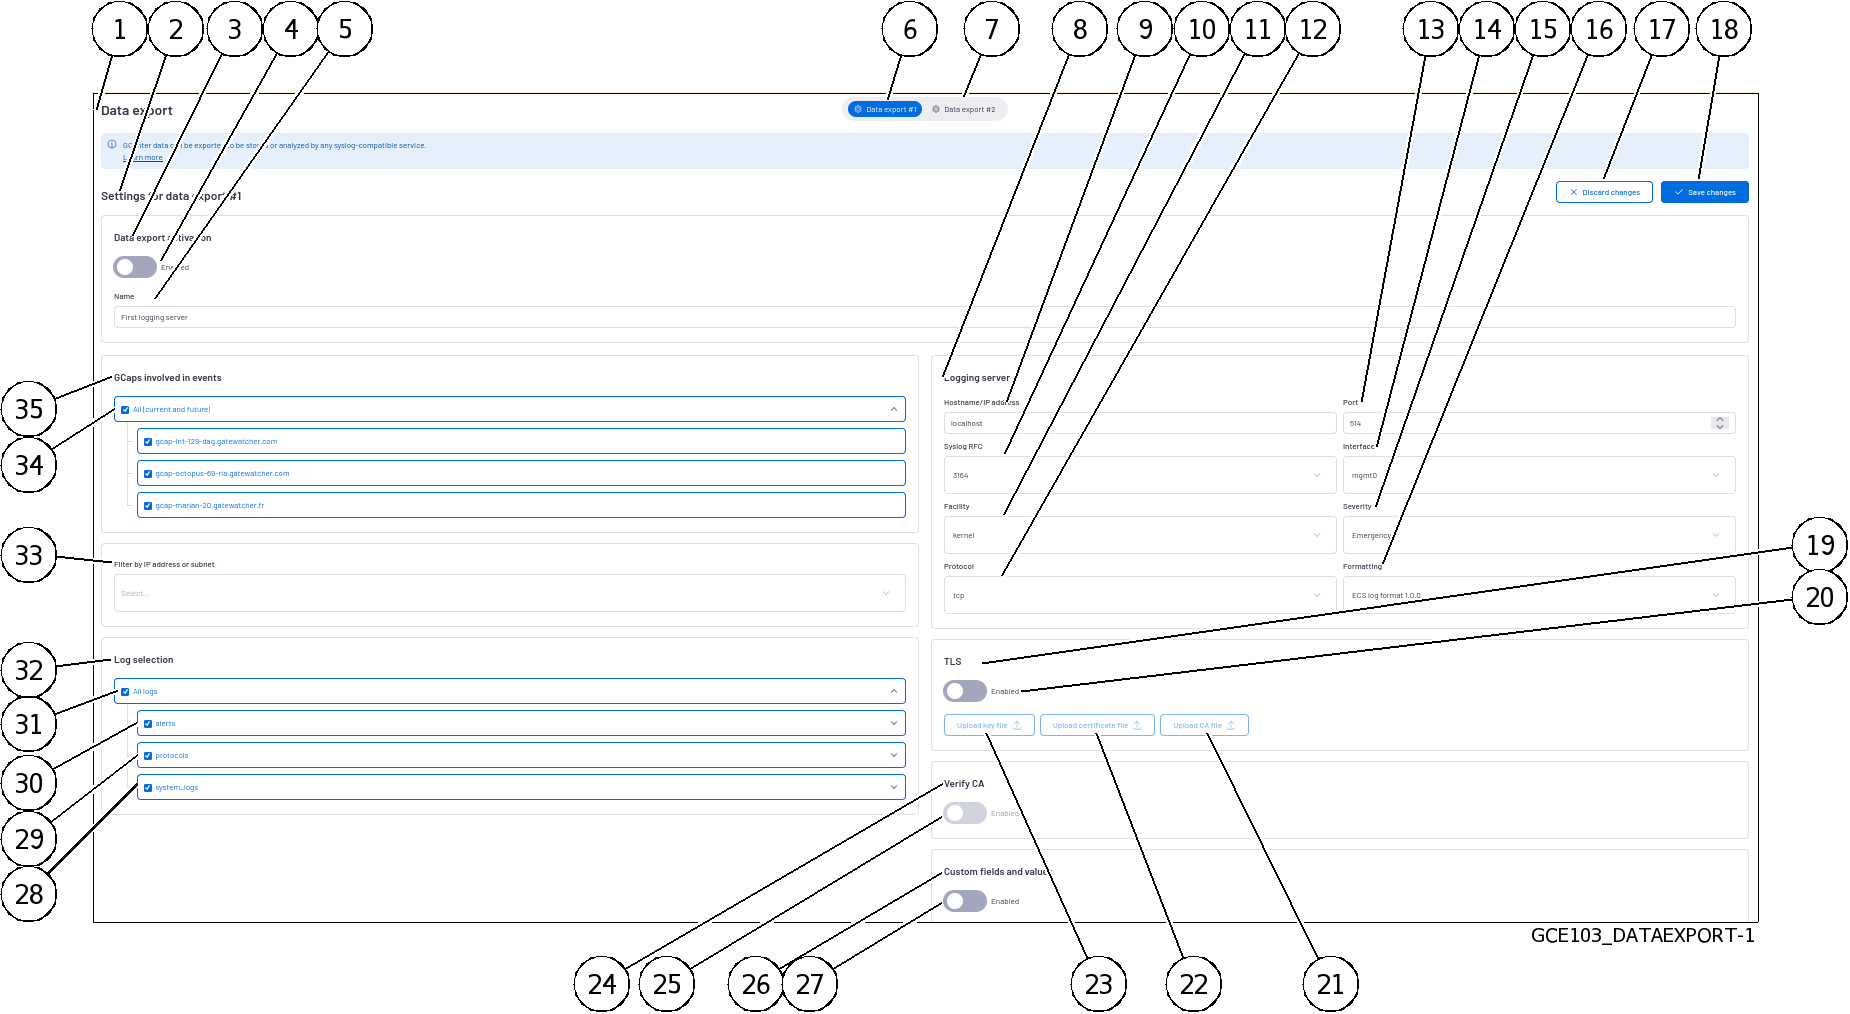
- Click the
`Data export #1`button (6).The`Settings for data export #1`area (2) is displayed. - Enter the necessary parameters.The list of items is detailed in `Data export` screen.
Item
Name
Value to enter
4
`Enabled`selector
Activated
5
`Name`
$SYSLOG_NAME
9
`Hostname/IP address`
$LOGSTASH_IP
10
`Syslog RFC`
3164
11
`Facility``facility`default kernel; header will be removed by the reception pipeline12
`Protocol`
$PROTOCOL
13
`Port`
$LOGSTASH_PORT
14
`Interface`15
`Severity``severity`in the Syslog headeremergency by default; the header will be deleted by the reception pipeline16
`Formatting`
26
`Custom fields and values`27
`Enabled`selector
Activates the feature. Disabled by default.
32
`Log selection`31
`All logs`
`alerts`(30),`protocols`(29),`system_logs`(28)The alerts types are detailed in the note below.The protocols types are detailed in the note below: these protocols are the Sigflow protocols.The system_logs has only one choice: notification.33
`Filter by IP address or subnet`Allows to select the events source with its IP address or subnet. By default, all data is sent to the remote server if the field is empty.
35
`Gcap involved in events`34
`All (current and futures)`
17
`Ip addresses`Filter by IP or networks. By default, all data is sent to the remote server if the field is empty
Note
`Select All` selects all the protocols listed: a protocol that is not selected will not be exported.`Deselect all`.Note
`TLS` zone and `Verify CA` enables the encryption of the flow generated by the GCenter.- Validate using the
`Save changes`button (18).The following message indicates that the update has been completed:`Updated with success`.
8.6.2.6. Procedure to be performed on the server
Configure the flow receiving pipeline from the GCenter.
8.6.2.6.1. Pipeline Logstash
yaml
input {
  syslog {
    port => $LOGSTASH_PORT
    type => syslog
    grok_pattern => '^<%{NUMBER:syslog_priority}>(?:1 |)(?:%{SYSLOGTIMESTAMP:syslog_timestamp}|%{TIMESTAMP_ISO8601:syslog_timestamp}) %{SYSLOGHOST:syslog_hostname} (?:gatewatcher\[-\]:|gatewatcher - - \[-\]) %{GREEDYDATA:syslog_message}\n$'
  }
}
yaml
filter {
  prune {
    whitelist_names => [ "syslog_message" ]
  }

  json {
    source => "syslog_message"
  }

  mutate {
    remove_field => [ "@version","syslog_message" ]
  }
}
yaml
output {
  file {
    path => '/usr/share/logstash/data/output/%{[type]}-%{+YYYY.MM.dd}.log'
    codec => json_lines
  }
}