2.2.7. Sigflow detection engine
To analyze the captured flow, the following steps must be taken:
Activate one or more capture interfaces on the GCap
Pair the GCap and GCenter
Activate of the Sigflow monitor engine, by default it is deactivated
2.2.7.1. Activate one or more capture interfaces on the GCap
2.2.7.1.1. CLI commands
Managing the capture interfaces is done using the CLI commands listed in the Summary of orders by theme and level table.
2.2.7.1.2. Use case procedures
To view or configure the capture interfaces, refer to the table Manage the network.
2.2.7.2. Aggregation of capture interfaces `monx`
2.2.7.3. Pairing the GCap with GCenter
2.2.7.4. Activating the Sigflow monitor engine
By default the GCap monitor engine is disabled.
2.2.7.4.1. Checking the status of the Sigflow monitor engine (activating procedure)
The status of the engine can be checked with the `show status` command.
2.2.7.4.2. Starting the Sigflow analysis engine
The command prompt is displayed.
(gcap-cli)
Enter the monitoring-engine start command
- Validate
monitoring-engine start
The system displays the following message indicating that the engine started.Starting Detection Engine... This operation may take a while... Please wait. etection Engine has been successfully started.
Once the monitor engine is activated, the configuration possibilities of the GCap probe change.Some of them cannot be configured while the engine is running.Note
The
`eve-stats`command in the`show`sub-group enables displaying the Sigflow (monitoring-engine) statistics.
2.2.7.4.3. Grace period
The grace period is the sum of:
The maximum starting time
The maximum stopping time
In order to be able to load the rules of the detection engine before starting the engine, the engine cannot start until a certain time called maximum start time or startup grace period (start-timeout).
The current value is displayed using the show monitoring-engine start-timeout command.
If the number of rules loaded by the monitor engine is large then the maximum start time must be changed via the set monitoring-engine start-timeout command.
Similarly, there is the maximum stopping time or grace period when the engine shuts down (stop-timeout).
The current value is displayed using the show monitoring-engine stop-timeout command .
The modification of the current value is done via the set monitoring-engine stop-timeout command.
2.2.7.5. Deactivating the Sigflow monitor engine
2.2.7.5.1. Checking the status of the Sigflow monitor engine (deactivating procedure)
The status of the engine can be checked with the `show status` command.
2.2.7.5.2. Stopping the Sigflow monitor engine
In the same way, stopping is carried out with the monitoring-engine stop command:
monitoring-engine stop
The system displays the following message indicating that the engine stopped.
Stopping Detection Engine...
This operation may take a while... Please wait.
Detection Engine has been successfully stopped.
2.2.7.6. Compatibility mode
The compatibility mode between the GCap and GCenter must be specified via the set compatibility-mode command.
2.2.7.7. MTU
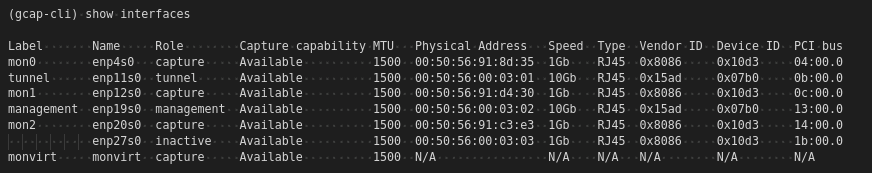
2.2.7.7.1. Display of the current MTU value
The MTU value can be displayed using the show interfaces command:
Note
Note that XDP Filtering features is not supported if the MTU > 3000.
2.2.7.7.2. Changing the current MTU value
Regarding the modification of the MTU, this is done with the set advanced-configuration mtu command followed by the parameters:
Name of the interface, for example enp4s0
Value, for example 1300
Note
To change the MTU of the enp4s0 interface to 1300 :
Enter the set advanced-configuration mtu enp4s0 1300 command
Validate
set advanced-configuration mtu enp4s0 1300
The system displays the parameter update information.
Updating Monitoring Network MTU configuration to:
      - enp4s0: 1300
2.2.7.8. Rebuilding files
The size of the observed file
The type of file observed, based either on the extension or on the filemagic
HTTP
SMTP
SMB
Note